What it does

Everything it does. Nothing it doesn't.

The complete tour, in the order you'd actually use it. One fictional company — Beacon Mechanical, an HVAC contractor — runs through every screen, and the screens below are the live product on its books. Check them. Every number in the product clicks down to the ledger; the demo is open to anyone, no signup.

Start here

The morning Brief: what needs you, in order.

Every night, after QuickBooks syncs, FuseGrid re-reads the whole business and ranks what it found — Bad, then Check, then Watch, then Good. Not twenty charts. A short list, ordered by what it costs you to ignore. Tap Explain on any finding and the copilot opens already loaded with the evidence — you start at the follow-up questions, not the blank prompt.

Some mornings it says nothing needs you. That's not a gap in the product. That's the product.

Read tomorrow's Brief — start free
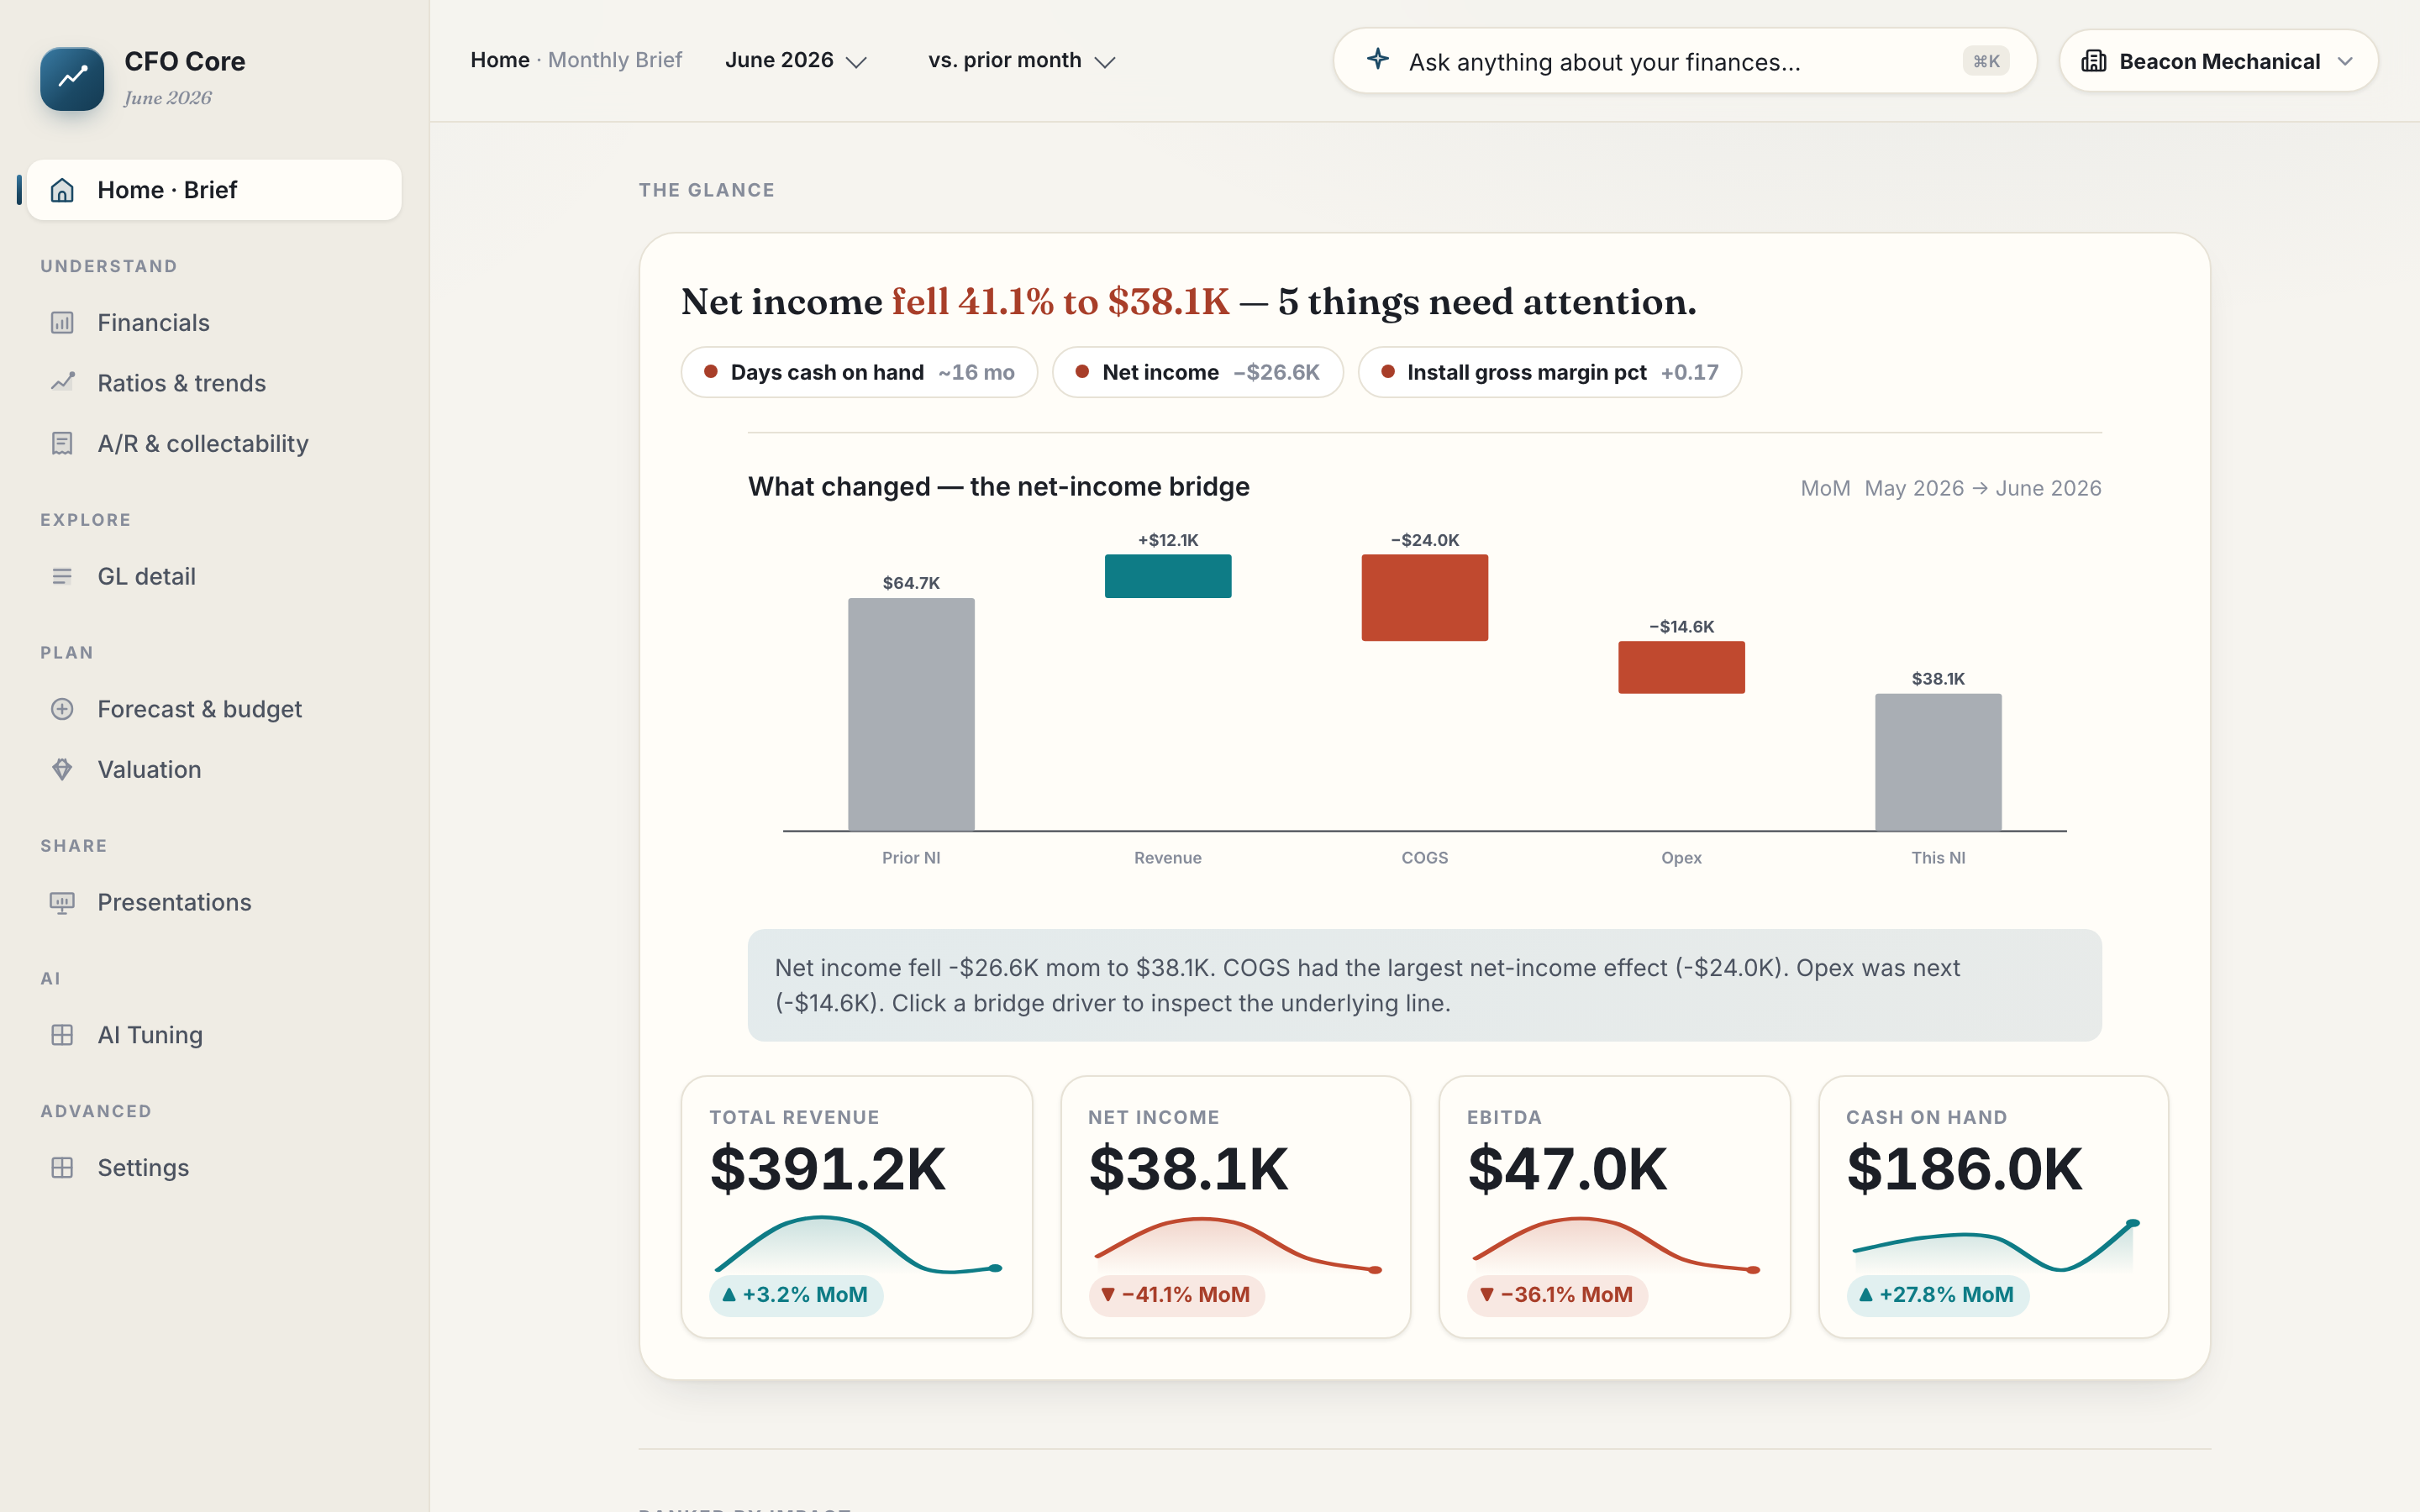
The morning Brief — headline, net-income bridge from May to June, and KPI tiles for revenue, net income, EBITDA, and cash — live product, sample data

Live product — sample data (Beacon Mechanical, a fictional company). Open this screen live — no signup →
The statements

Statements with the CFO's pen still on them.

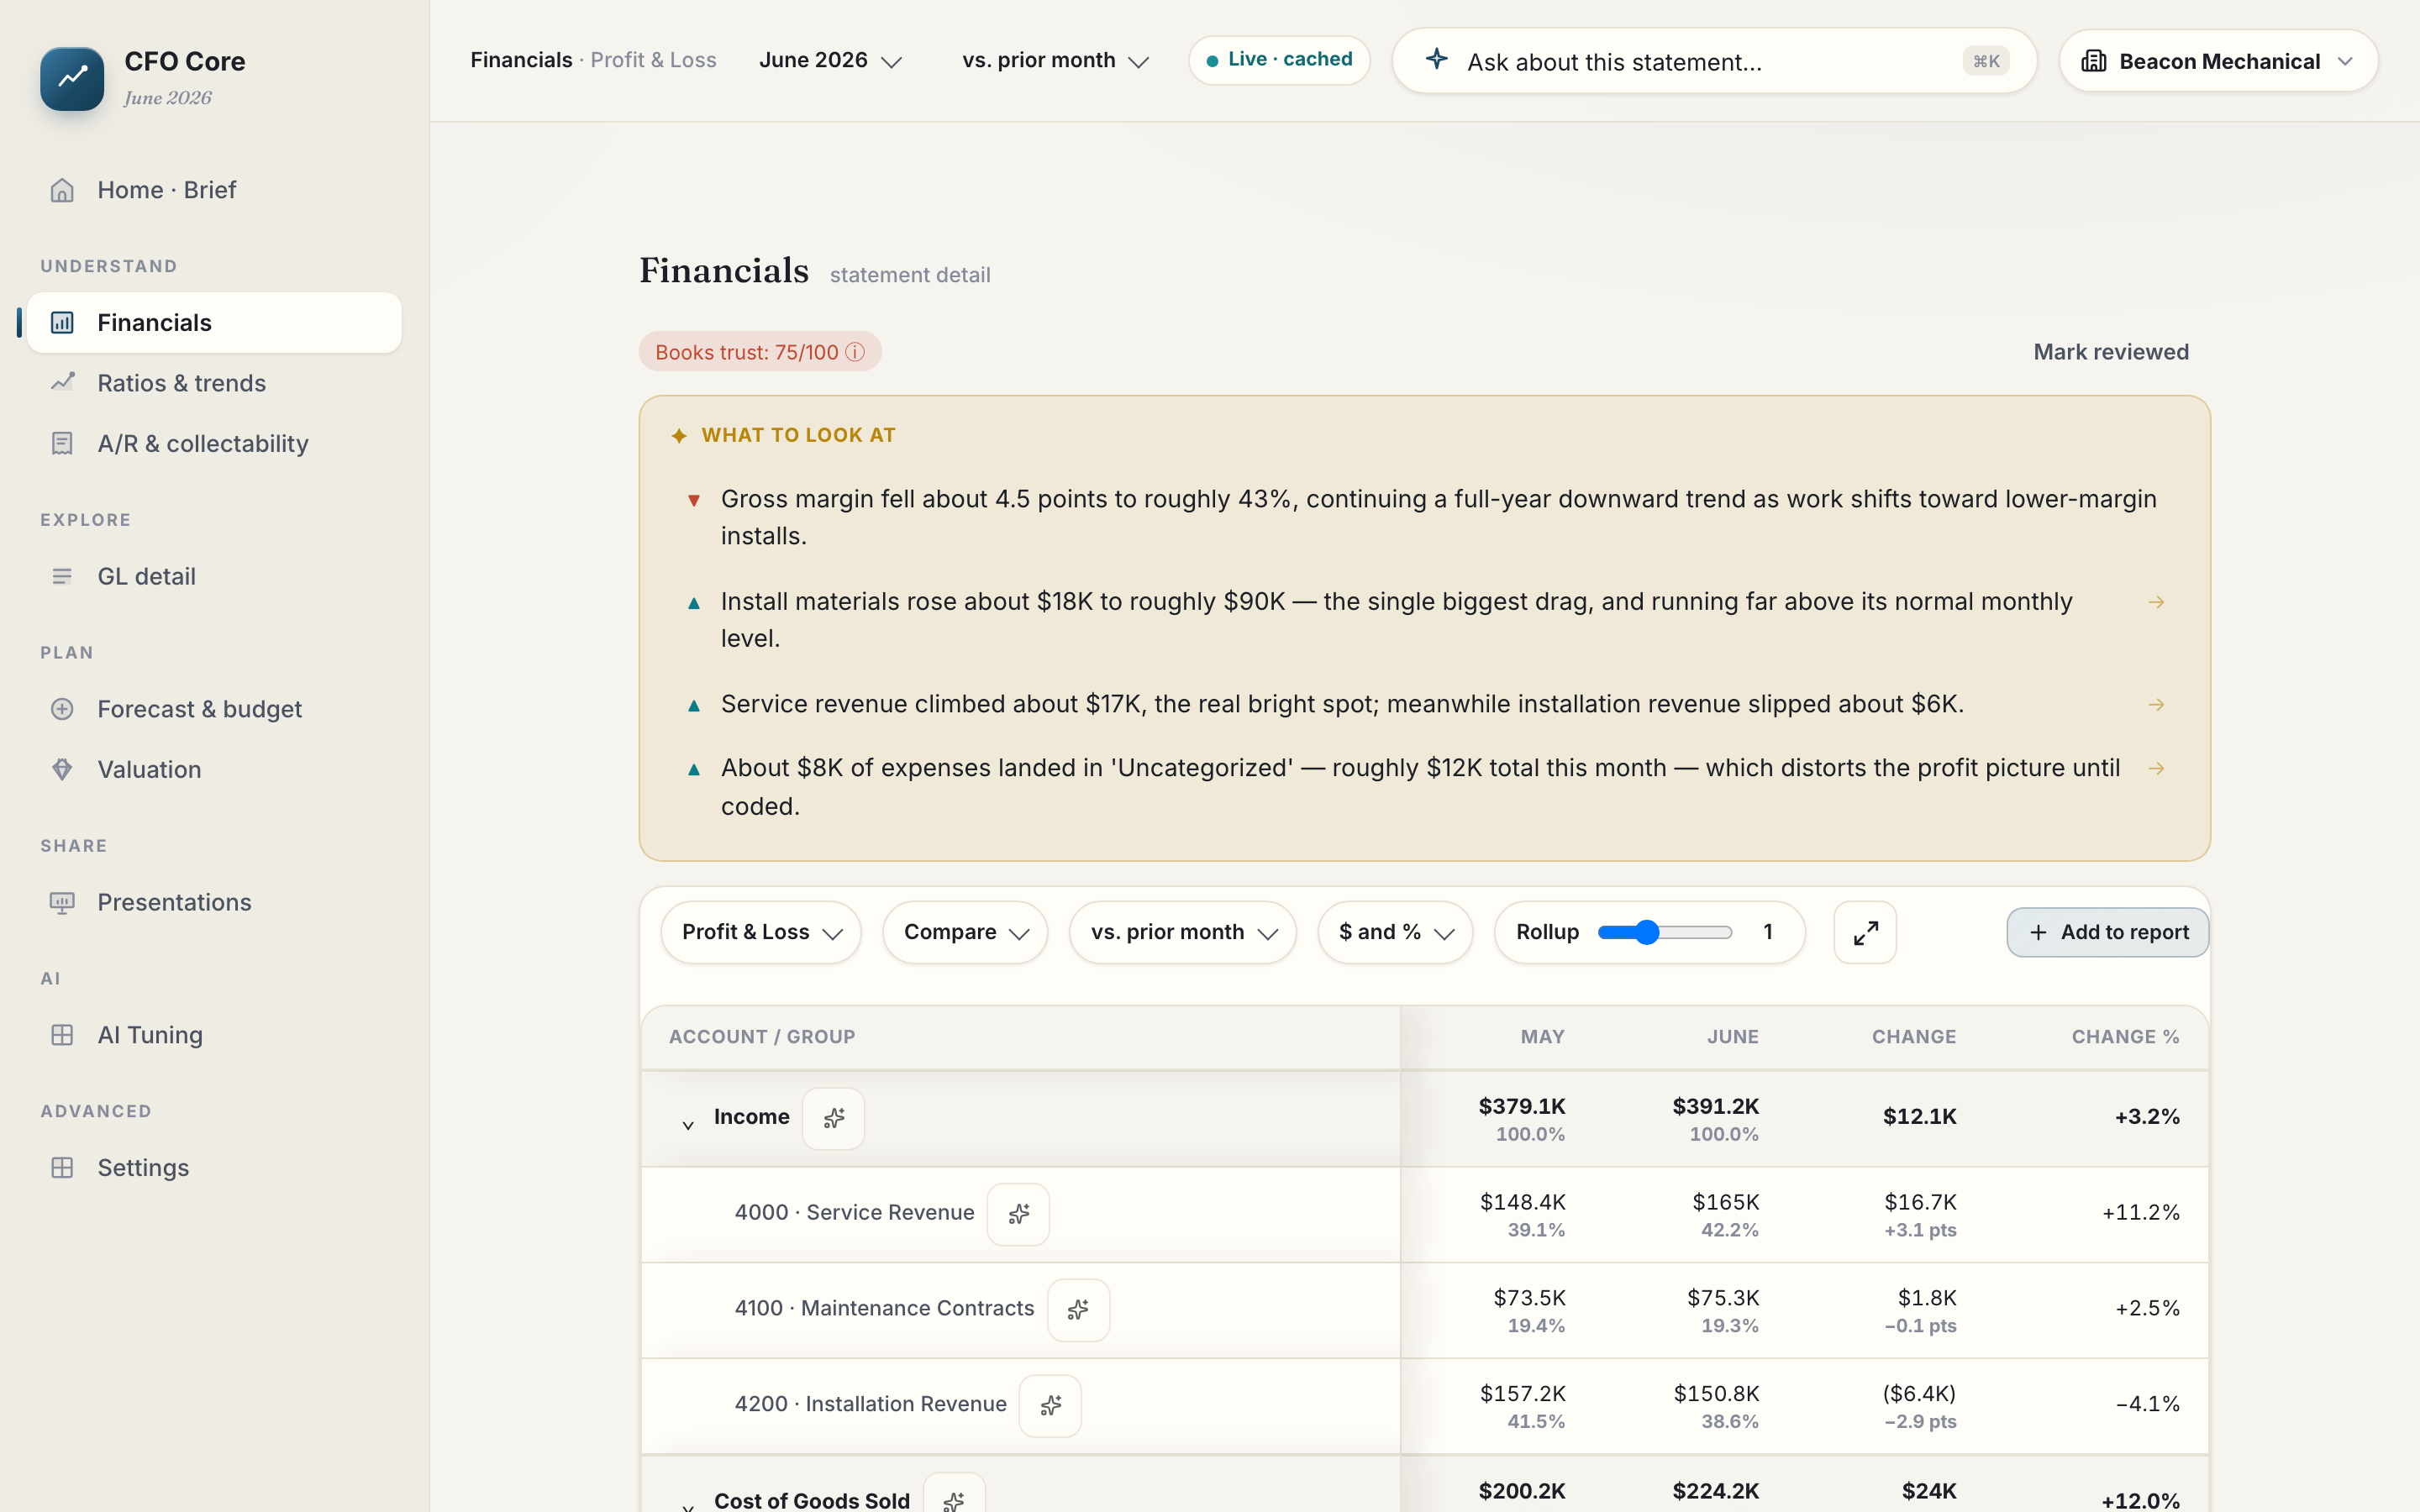
Each close, FuseGrid writes What stood out across the top of every statement, then flags the lines that earned a second look: statistical outliers against your own history, accounts that flipped sign, journal entries that land on suspiciously round numbers. It knows materiality — a $40,000 line moving is a finding; a $40 line moving is Tuesday. Five comparison windows (month, quarter, year, trailing 3, trailing 12), up to 60 months of history, and service-line contribution-margin badges sitting right on the revenue lines.

Beacon's June: gross margin slipped about four and a half points — Install materials on one job, not Service. The statement names the job.

See your June this way
Profit and Loss with the AI review — month-over-month compare, account numbers, and flagged lines — live product, sample data

Live product — sample data (Beacon Mechanical, a fictional company). Open this screen live — no signup →
Cash

Thirteen weeks of cash, week by week.

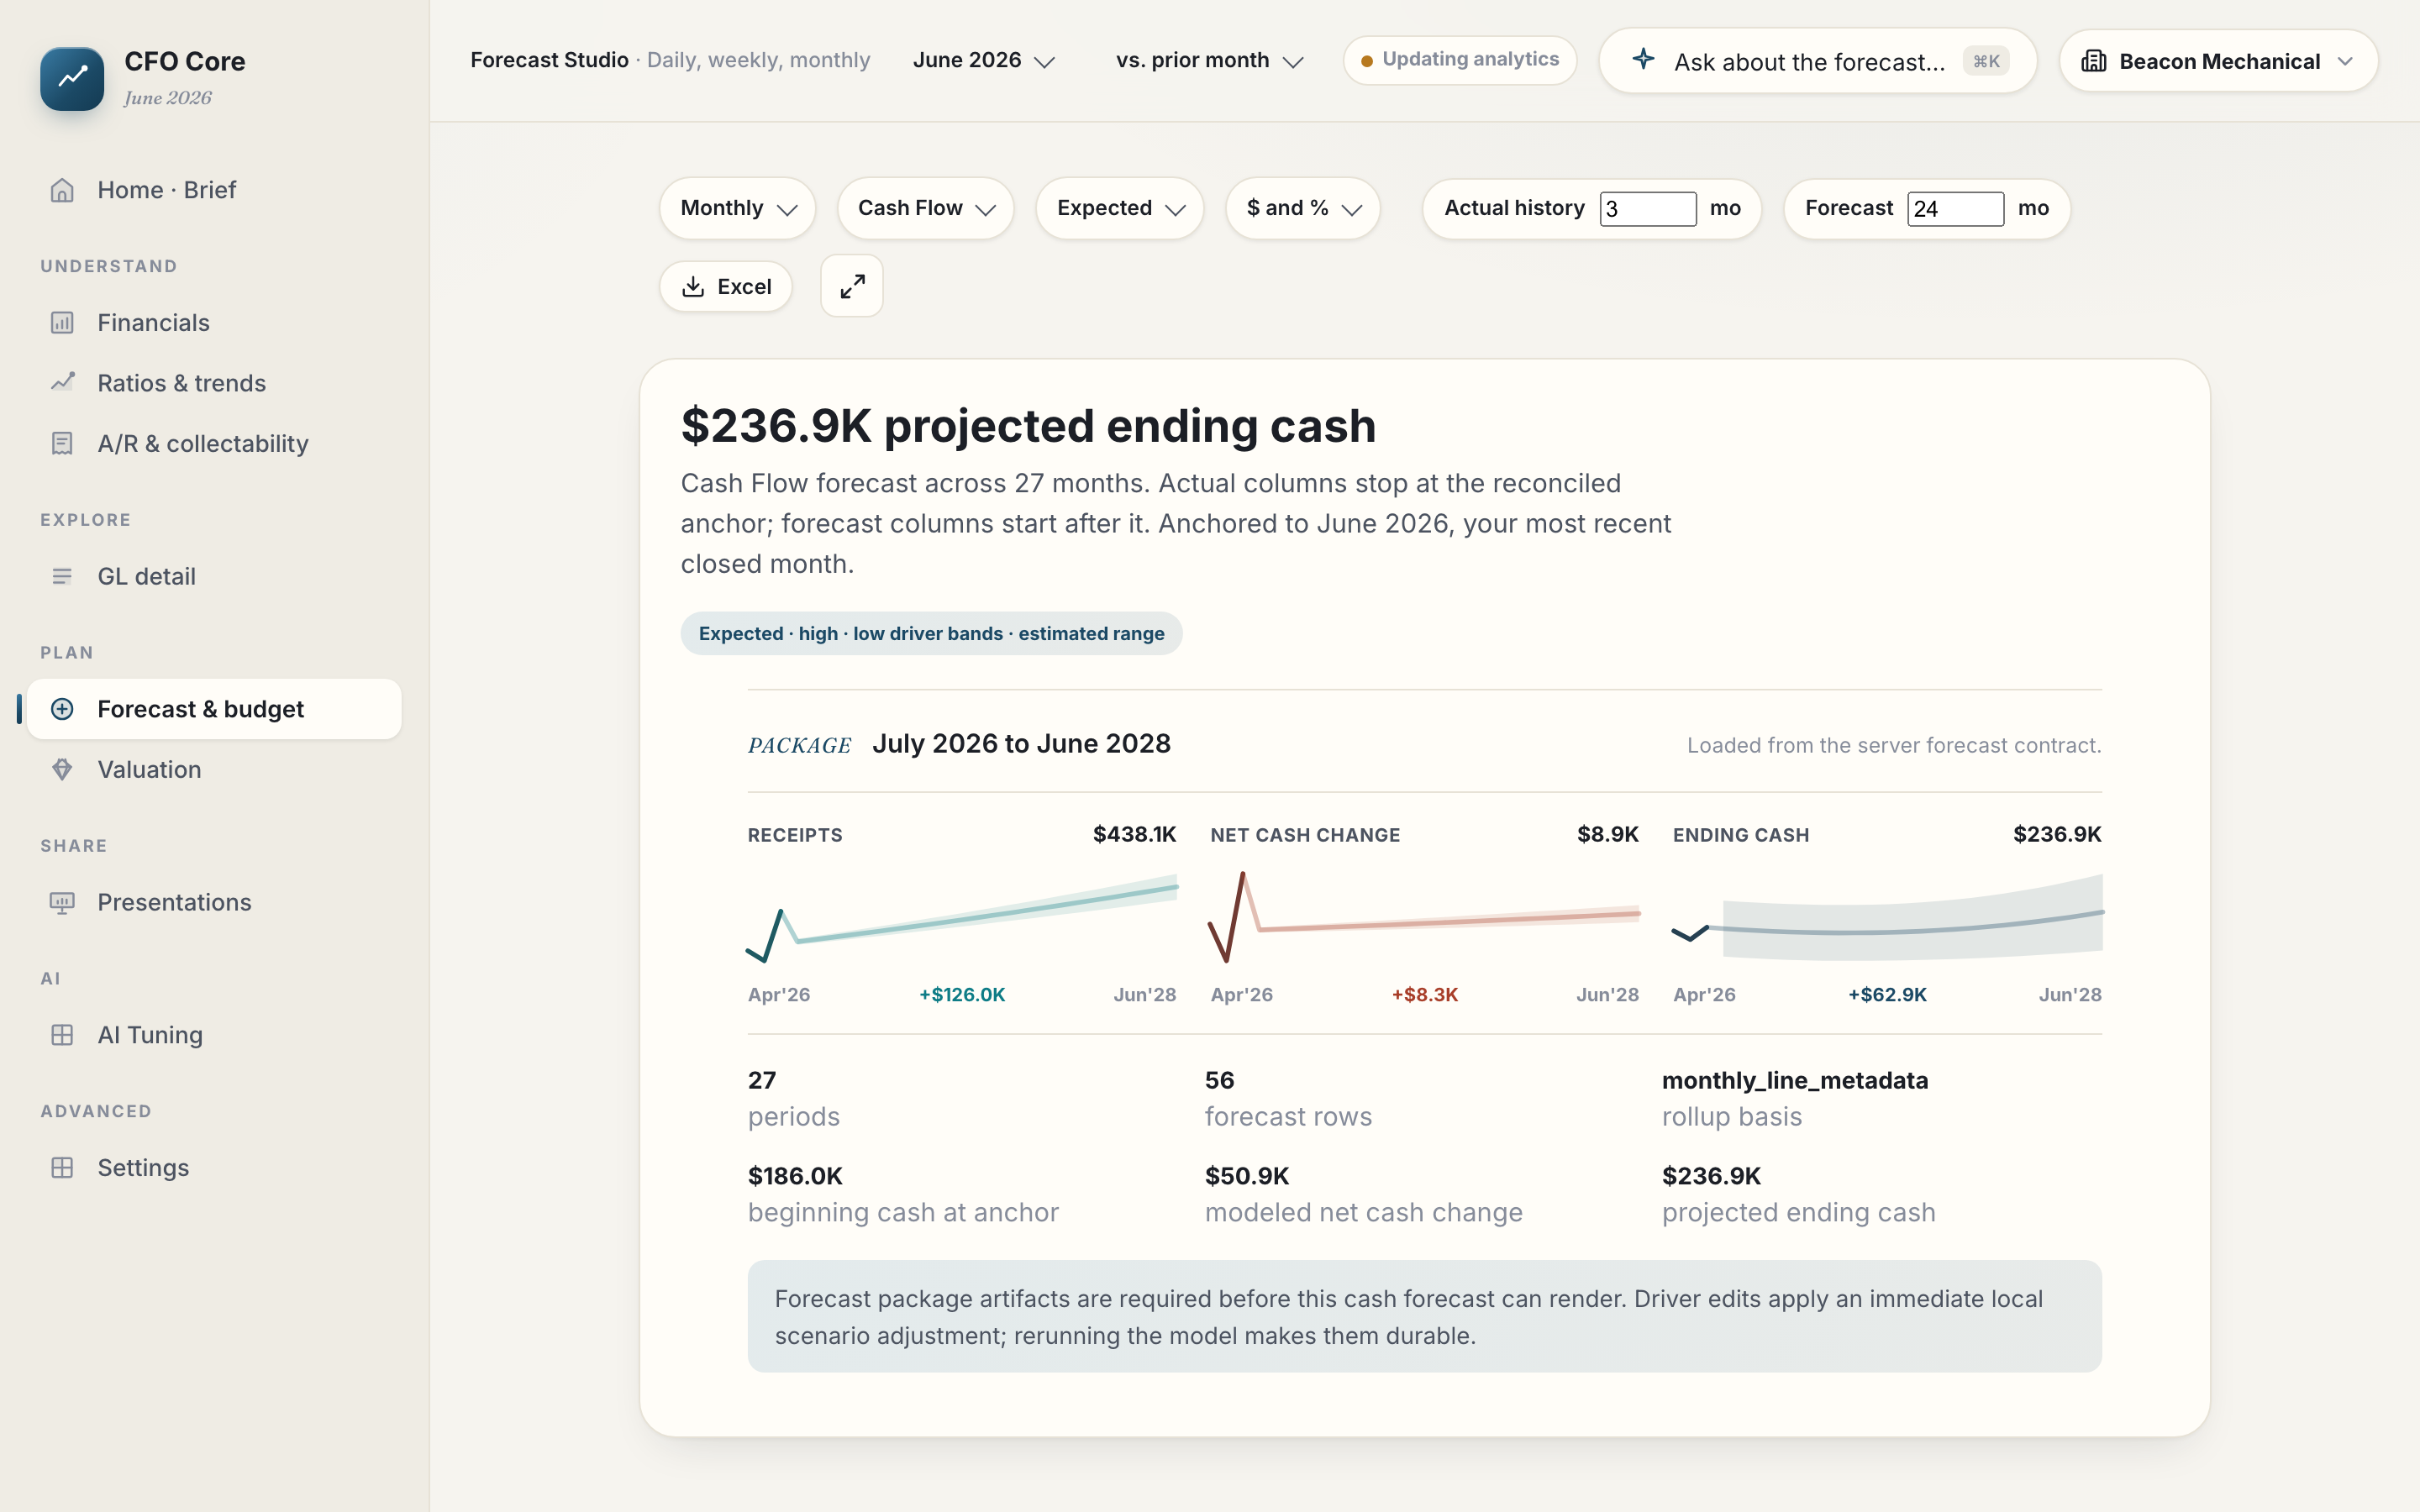
The forecast is timing-aware: it knows payroll is biweekly, it knows the quarterly insurance premium is coming, and it knows when each invoice is actually likely to pay — not just when it's due. So a tight week shows up while it's still weeks away and fixable. And when there's a move that fixes it, FuseGrid models the move — pull the right receivables forward and the trough recomputes on the spot.

A tight cash week is a phone-call problem — when the call happens weeks early. FuseGrid's job is making sure it does.

Included in Essentials, $99 a month. Knowing payroll clears shouldn't be the expensive part.

Find your tight week — start free
Forecast Studio — projected ending cash with receipts, net-cash, and ending-cash tiles, so a tight week shows up weeks ahead — live product, sample data

Live product — sample data (Beacon Mechanical, a fictional company). Open this screen live — no signup →
Early warning

Day 12, not day 42.

Pacing vs forecast compares what you've actually realized so far this month against what the forecast expected by this exact day — respecting your billing rhythm, not a naive run-rate that pretends every day is the same. Close insights land the same day the books close, not two weeks into the next month. And the Books Trust score prices the mess in dollars: $12,400 uncategorized, plus an Equipment Rental line landing on exactly $4,000, is a to-do list. "The books are a bit messy" is a shrug.

Every problem has two prices — the day-12 price and the day-42 price. You only ever pay one of them.

Pacing needs a forecast to pace against, so it ships with Pro.

Know by day 12 — start free
Pacing vs forecast · July
Day 12 of 31 · pacing is day-weighted, not a straight line
Revenueon pace for the monthOn track
Gross profittracking planOn track
Cash changeahead of planAhead
Books Trust — 1 check needs you
$12,400 uncategorized · Equipment Rental at exactly $4,000 · reconciliations current
Sample data — Beacon Mechanical, a fictional company
Getting paid

Who's slipping, who to call, what you'll recover.

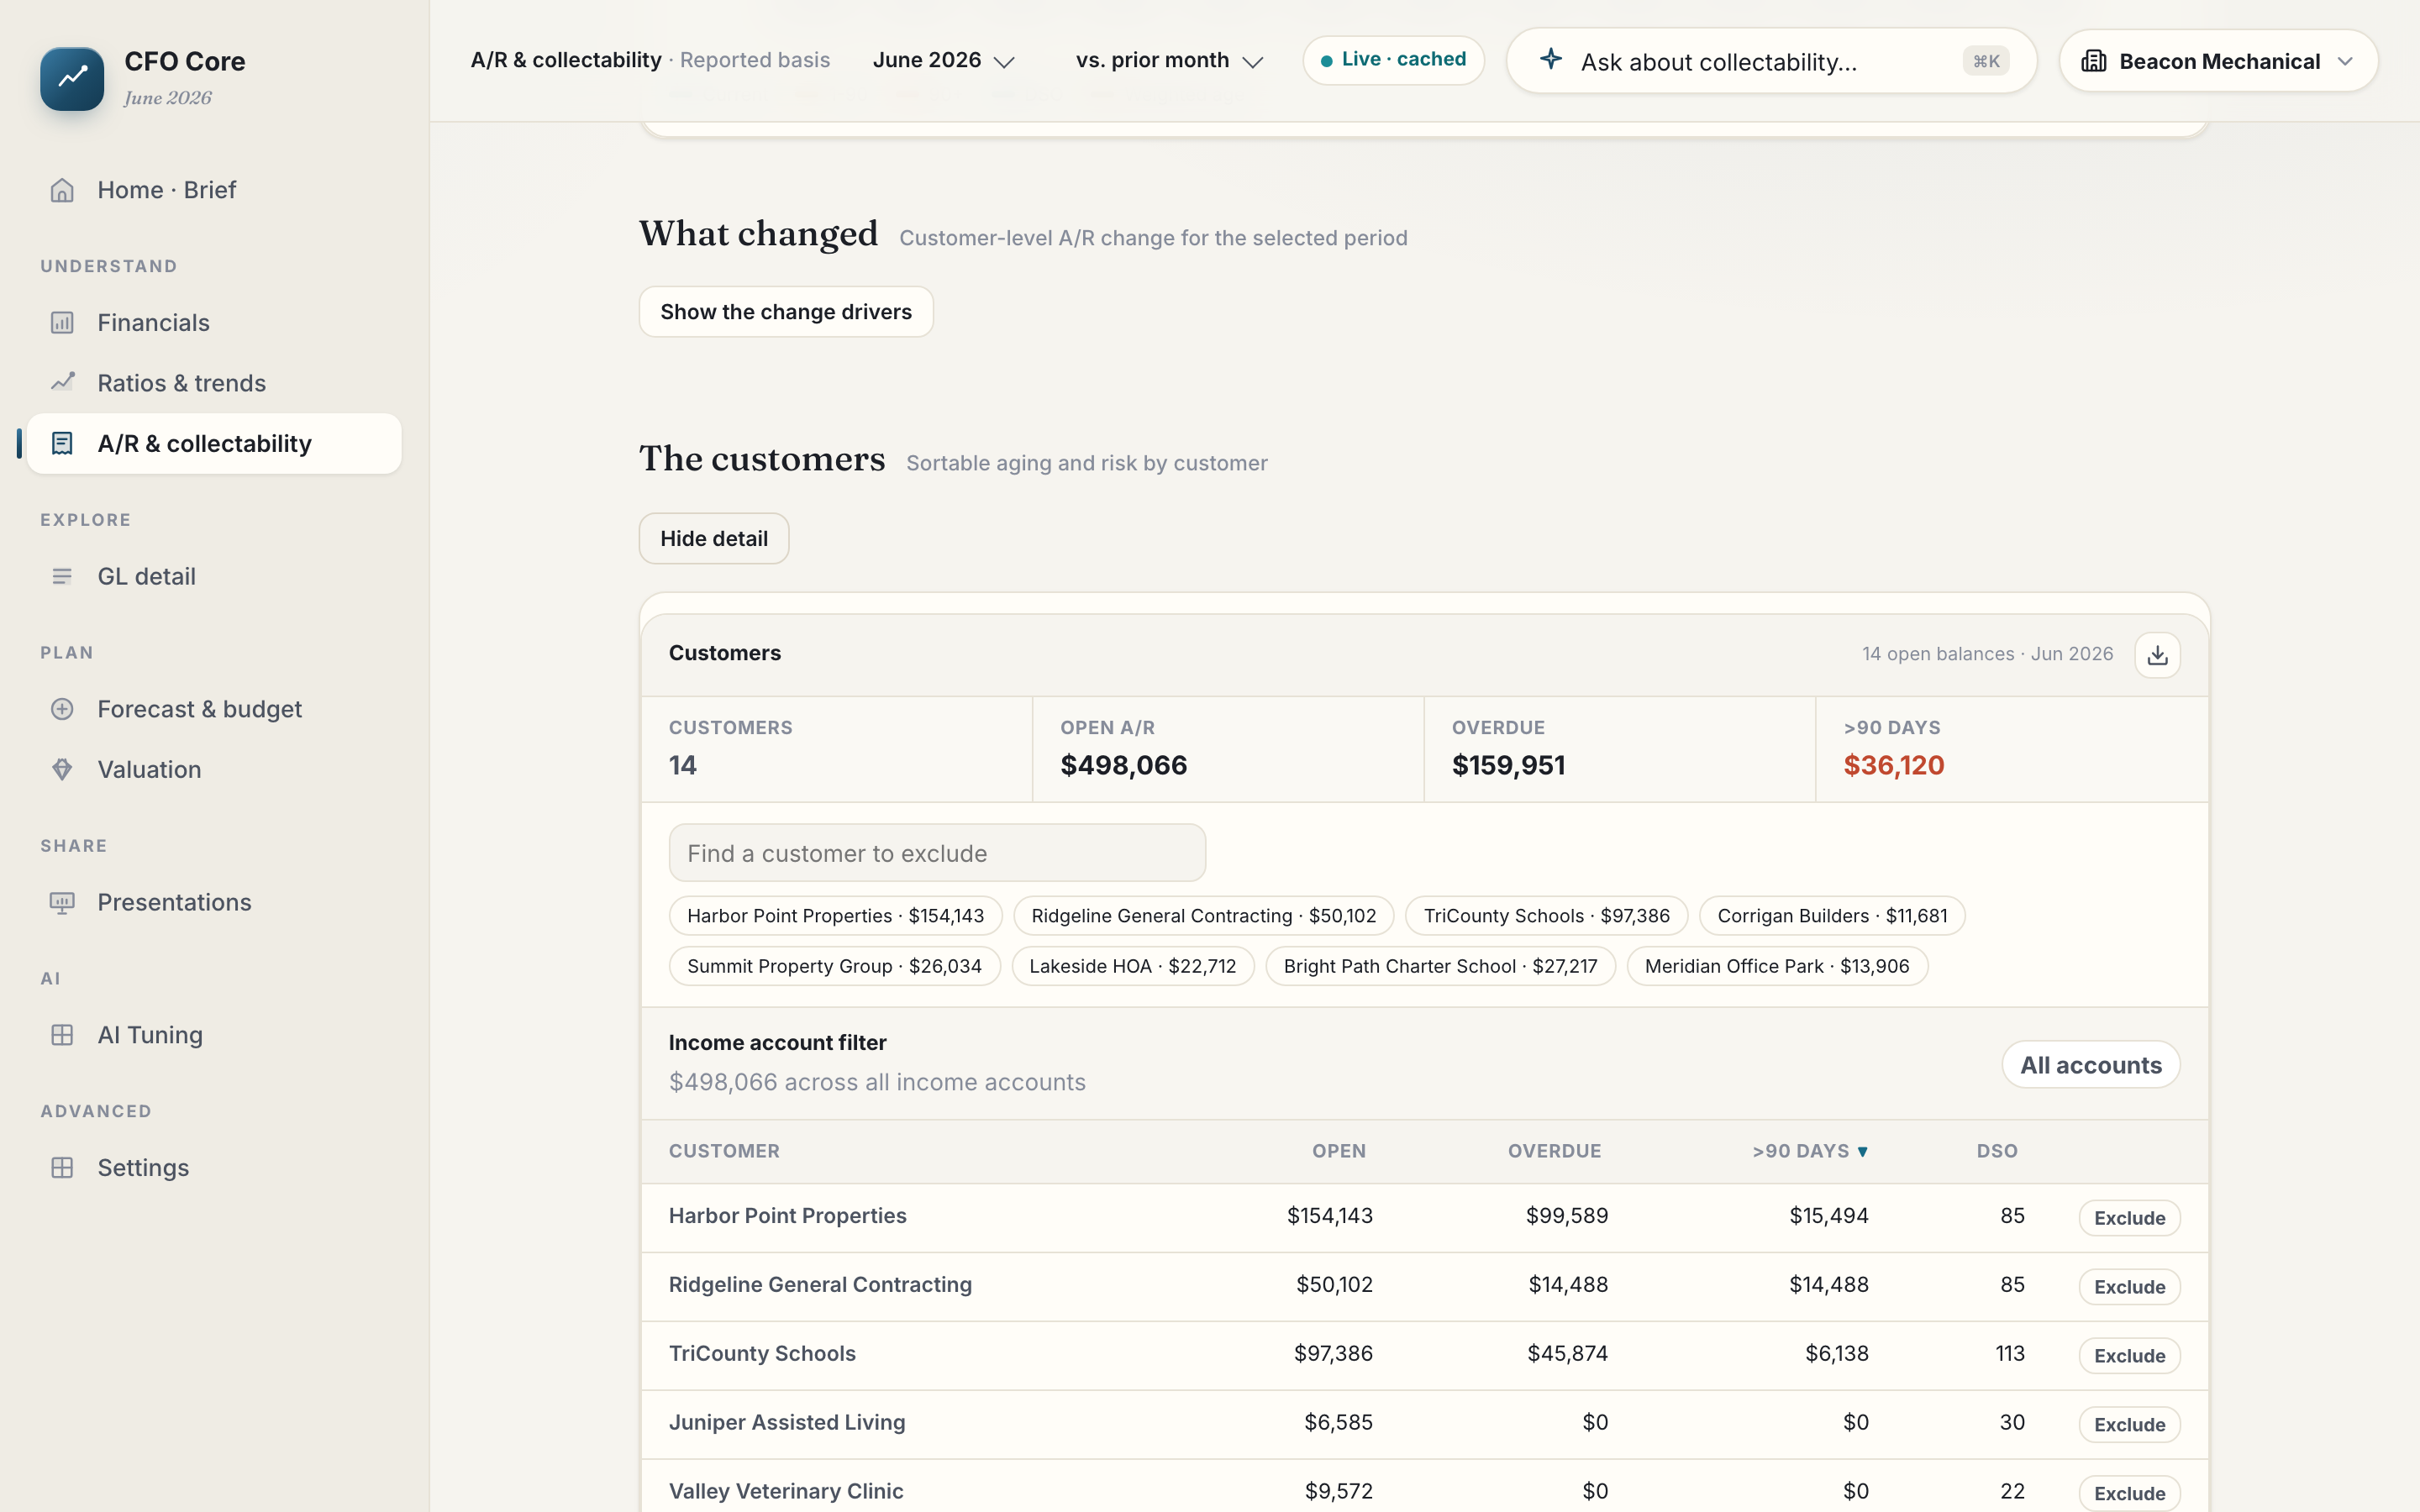
Your aging report knows who owes you. It doesn't know who changed. When Beacon's DSO crept up five days, FuseGrid named the customers who moved it — and put them in calling order. Every open invoice carries a risk score before it goes late, scored on how that customer has actually paid you. And history gets a vote: it shows what invoices like your oldest bucket have actually recovered, and sizes a reserve instead of a panic.

Chase the right three customers instead of politely re-invoicing everyone.

See who's slipping — start free
The customers table in A/R & collectability — every open balance by customer with overdue, over-90-day, and DSO columns, sorted into calling order; Harbor Point Properties tops the list at $154.1K — live product, sample data

Live product — sample data (Beacon Mechanical, a fictional company). Open this screen live — no signup →
The forecast

Twenty-four months out. Rebuilt every night.

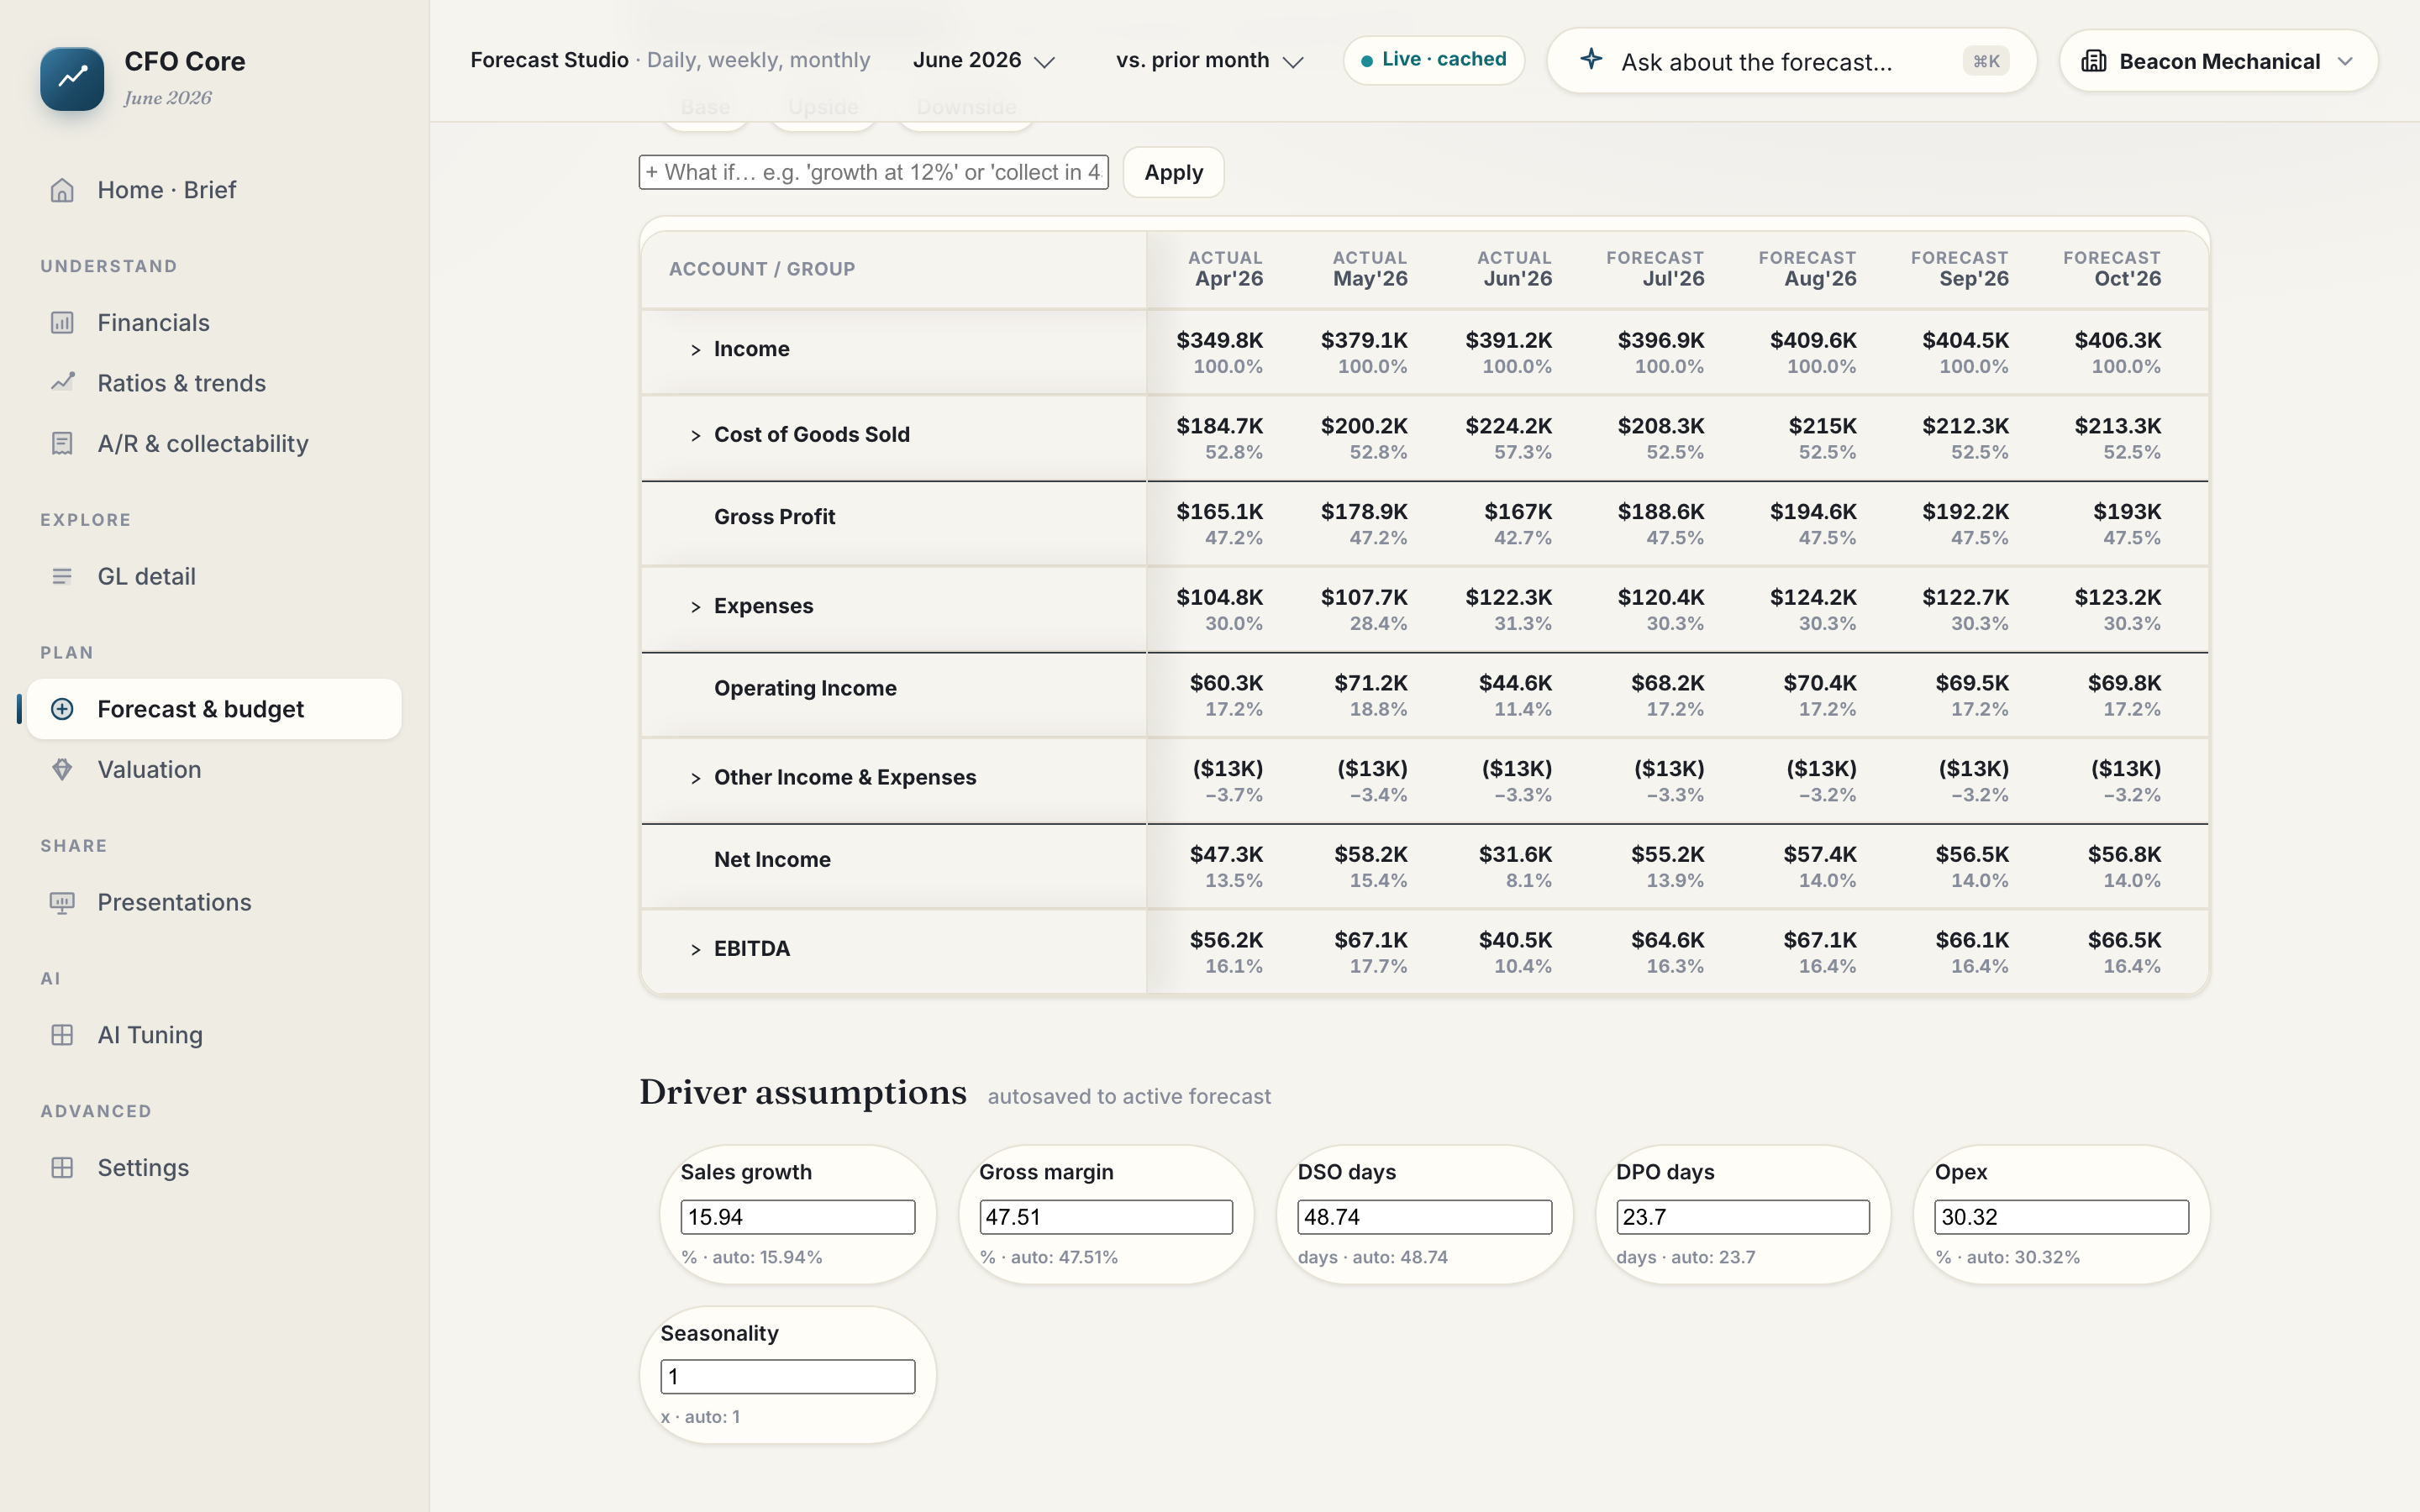
All three statements — P&L, balance sheet, cash flow, reconciled — forecast 24 months forward with High, Expected, and Low bands instead of false precision. Every night, as QuickBooks syncs, the whole model rebuilds; it never goes stale in a drawer. One click exports an 11-sheet Excel file with native formulas — your banker can trace every cell and toggle the cases on the Drivers sheet without asking you anything. And it grades its own homework: the Accuracy sheet backtests the model against your own closed months — predicted vs. actual, on the record.

"Trust me" is not a forecast methodology. A report card is.

The 24-month forecast, scenarios, and the Excel model are Pro — $349 a month. The consultant version of this file is $5,000, once, and stale by spring.

The forecast, in depth
Forecast Studio statement view — monthly P&L actuals rolling into 24 months of forecast columns, with Base / Upside / Downside cases and the driver assumptions that power the model — live product, sample data

Live product — sample data (Beacon Mechanical, a fictional company). Open this screen live — no signup →
The board pack

Tag it, draft it, send it. Revoke it later.

Every chart and card in FuseGrid has an Add to report button, so you collect the pack all month, as you find things. Come close, the AI drafts the narrative and you edit it inline — your words on top of its structure. Export a themed, native PowerPoint with real editable objects (charts your board can restyle, not screenshots), or PDF, or a web page. Or skip the file entirely: send a link that needs no login, pin it to June or let it always show the latest, and revoke it whenever you like.

From a lost weekend to eleven minutes.

Board packs and share links are Pro. If you need two banks to see one link with different data — per-viewer permissions — that's Enterprise.

See it on your own books — start free
Presentations · Board pack
Executive Review 5Profit & LossBalance SheetCash FlowA/R Trends
Performance review

Financial Review

Beacon Mechanical · June · Performance review and management discussion
Prepared report
Executive Review✦ Ask AI
Total revenue
$391.2K
Latest period
Net income
$38.1K
9.7% net margin
EBITDA
$47.0K
Analytical non-GAAP
Gross margin
42.7%
Revenue quality
Executive summary

June revenue rose 3.2% to $391K; the story is margin — gross margin slipped about four and a half points to 42.7% on Install materials. Cash is $186K. Collections slowed: DSO is up about five days, to roughly 41.

Net Income MoM Bridge May → June
$64.7K
+$12.1K
−$24.0K
−$14.6K
$38.1K
Prior NIMayRevenueCOGSOpExThis NIJune
Prior / starting totalFavorableUnfavorableCurrent total
Share — anyone with the link · view-only
fusegrid.io/share/cfo/bcn-jun-…Copy link
Pinned to June · revocable anytime · no FuseGrid account needed
Sample data — Beacon Mechanical, a fictional company
The scoreboard & the price tag

Are you good? And what is it worth?

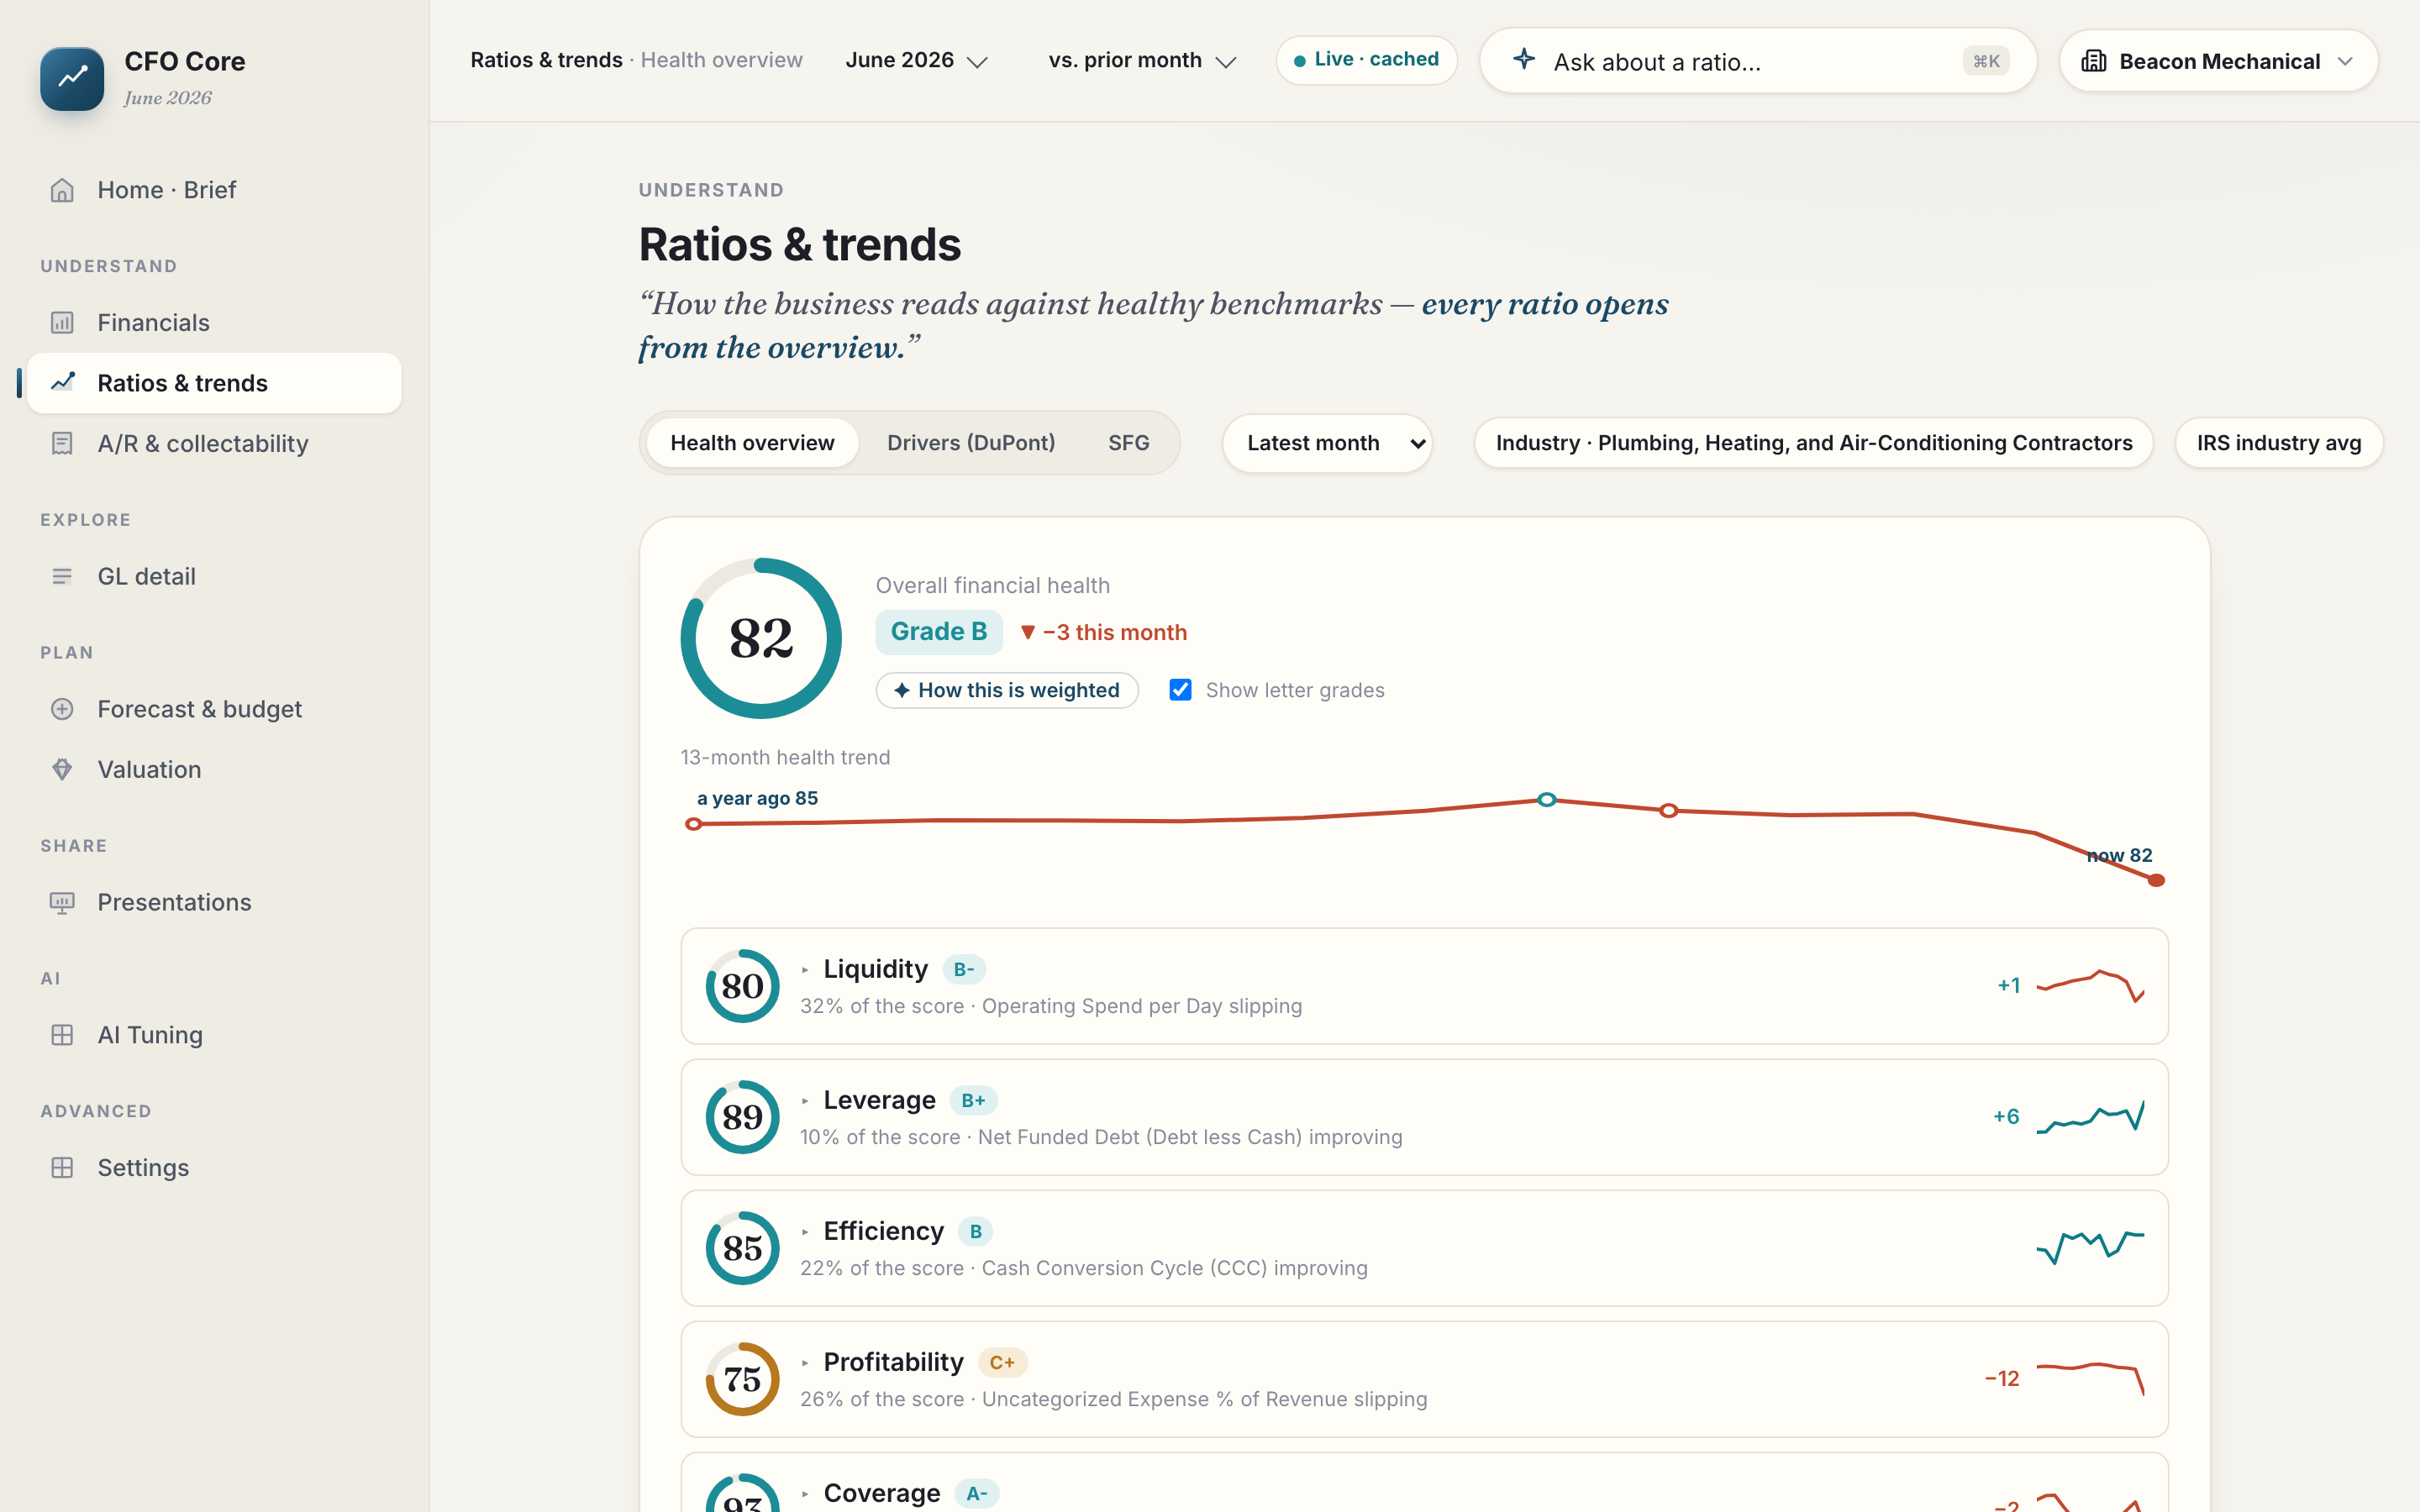
Every ratio is benchmarked against IRS industry averages — 400+ industry codes built from filed returns, not a vendor's made-up index — so "we're fine" finally gets an answer to fine compared to what? A DuPont breakdown shows whether your returns come from margins, asset turns, or debt. Service-line margins show which parts of the business earn their keep.

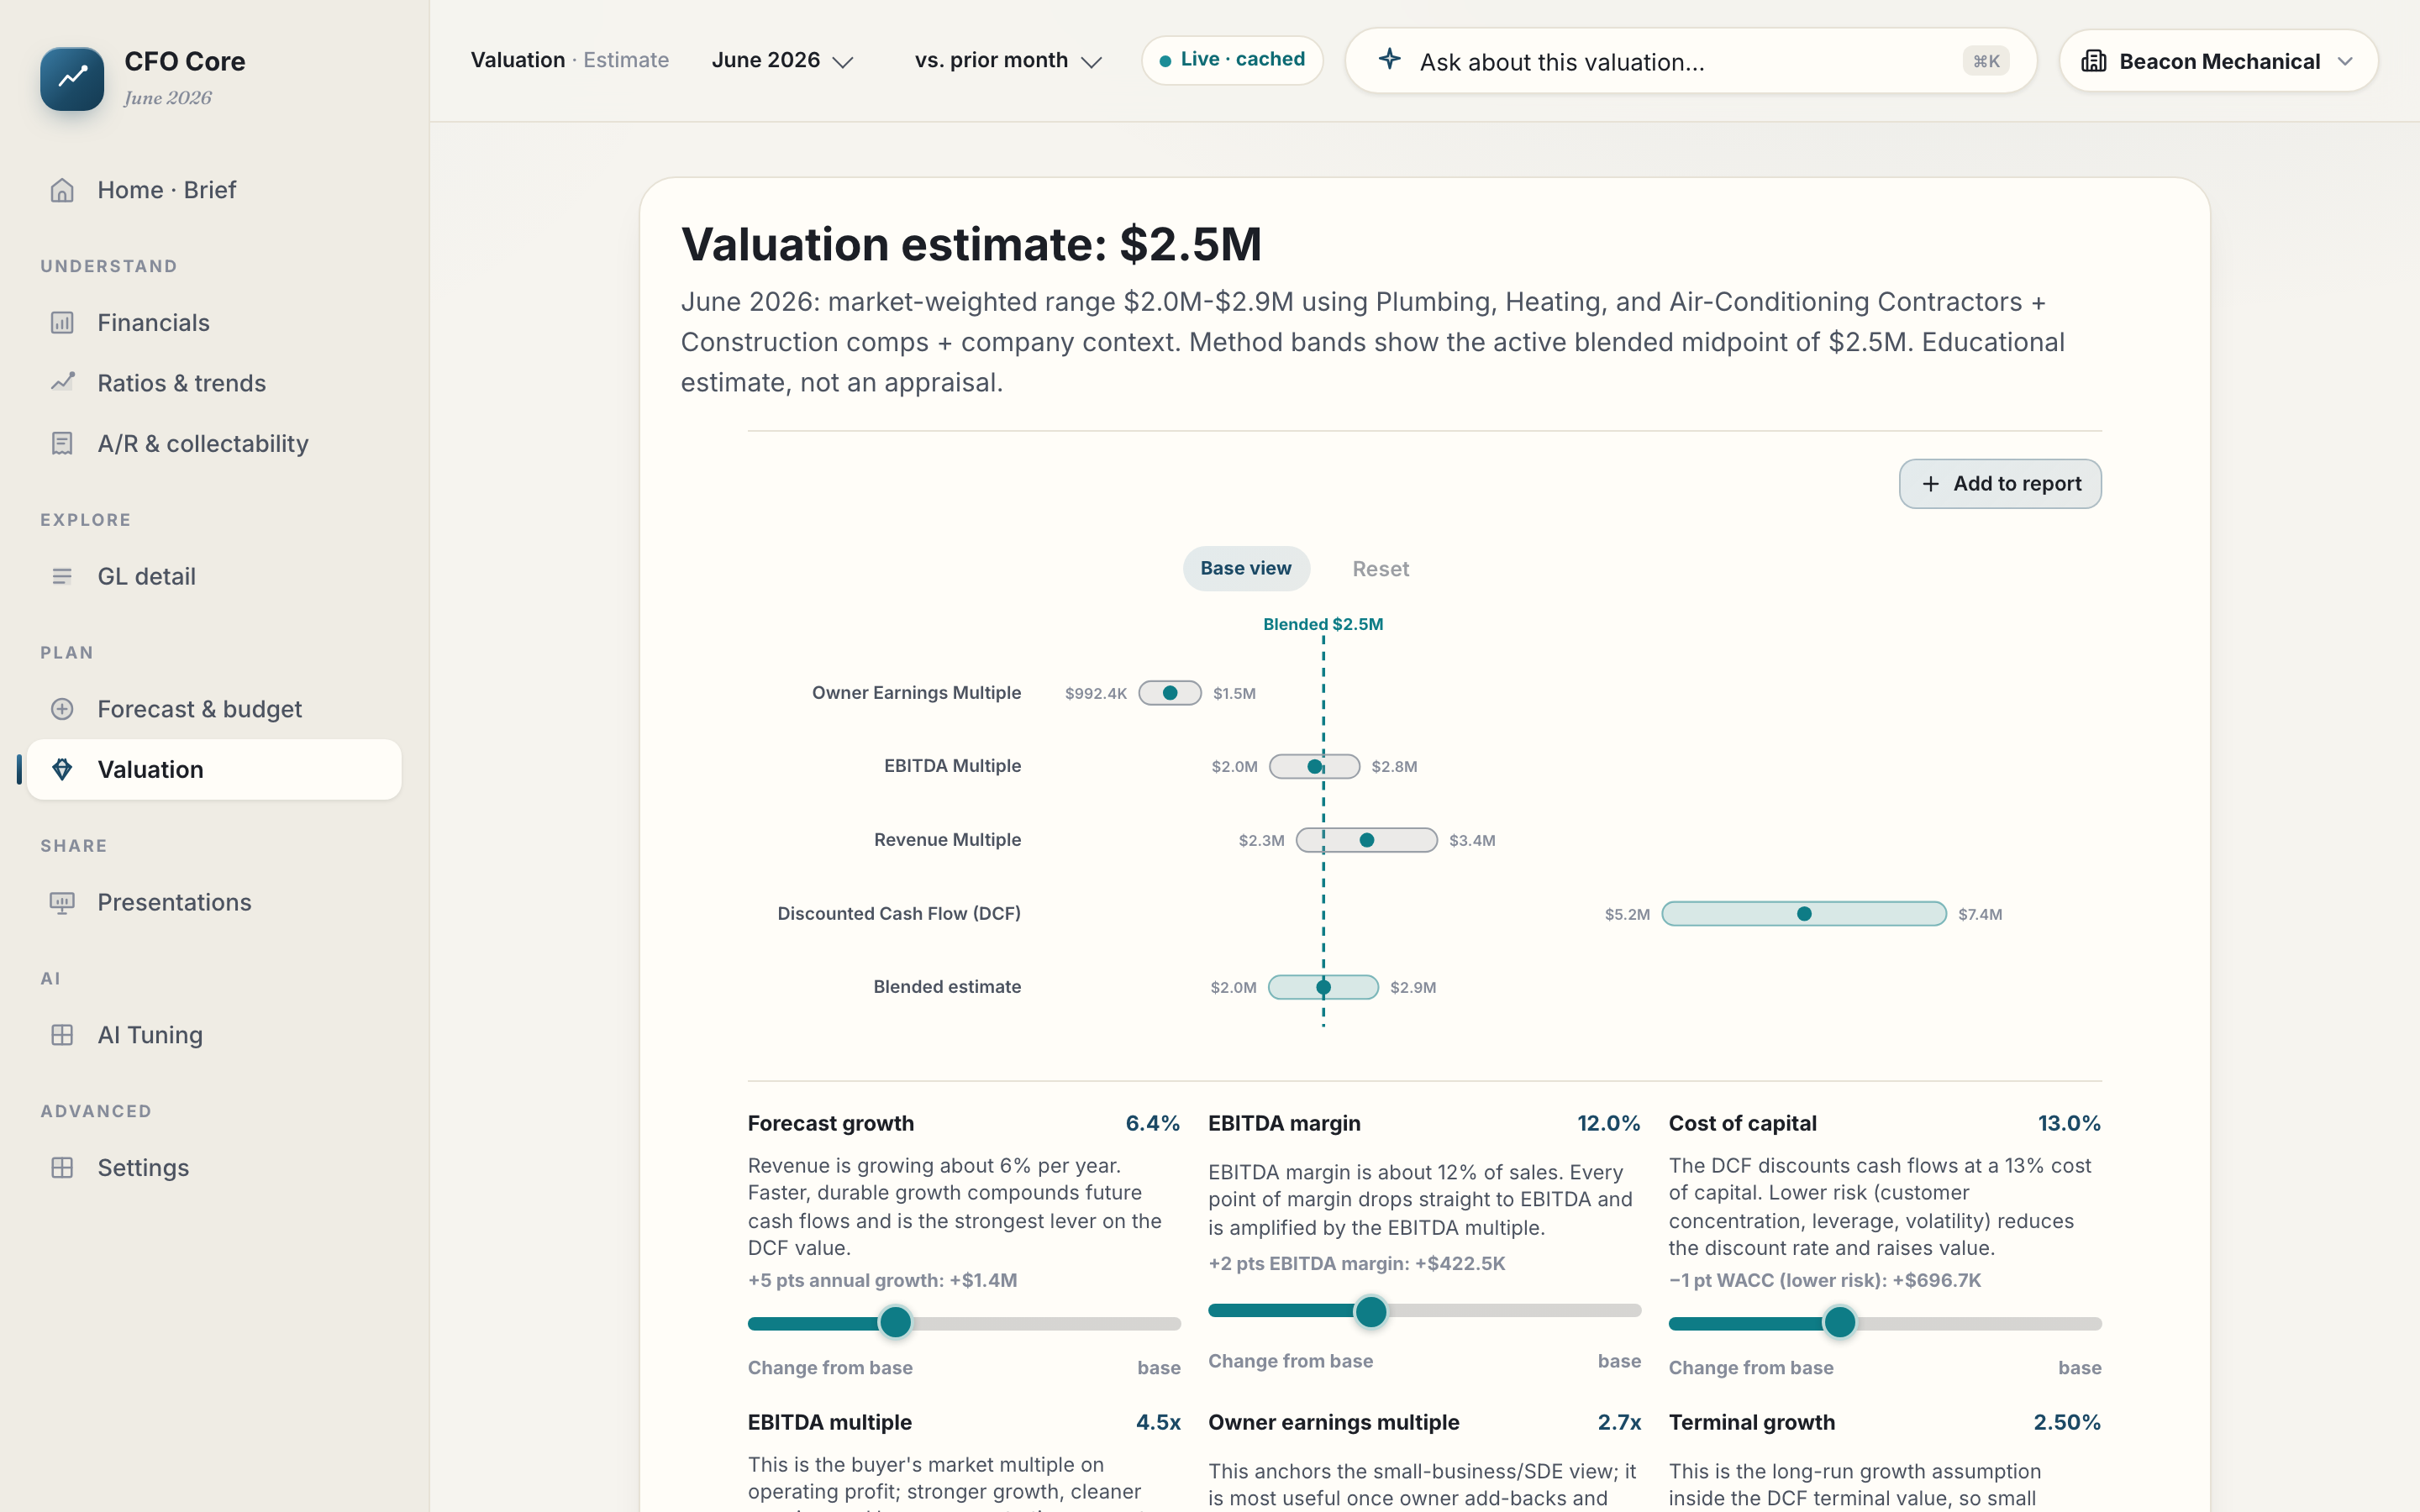
Then the price tag: four valuation methods — owner earnings, EBITDA multiple, revenue multiple, discounted cash flow — blended into one estimate with a football-field range. Drag the sliders and watch the number move. The levers are ranked in dollars at sale — the page shows what each point of gross margin is worth to your number.

Not a someday number — a today number, with a to-do list attached.

Benchmarks ship in Essentials. The valuation is Pro.

See your scoreboard — start free
Ratios and trends — composite health score with per-category scores and IRS industry benchmarks — live product, sample data

Live product — sample data (Beacon Mechanical, a fictional company). Open this screen live — no signup →
Valuation — inputs, four weighted methods, and the blended estimate with its range — live product, sample data

Live product — sample data (Beacon Mechanical, a fictional company). Open this screen live — no signup →

For the diligent

The parts you find on day three.

Two surfaces that don't make the headline but end up carrying half the clicks.

The GL explorer

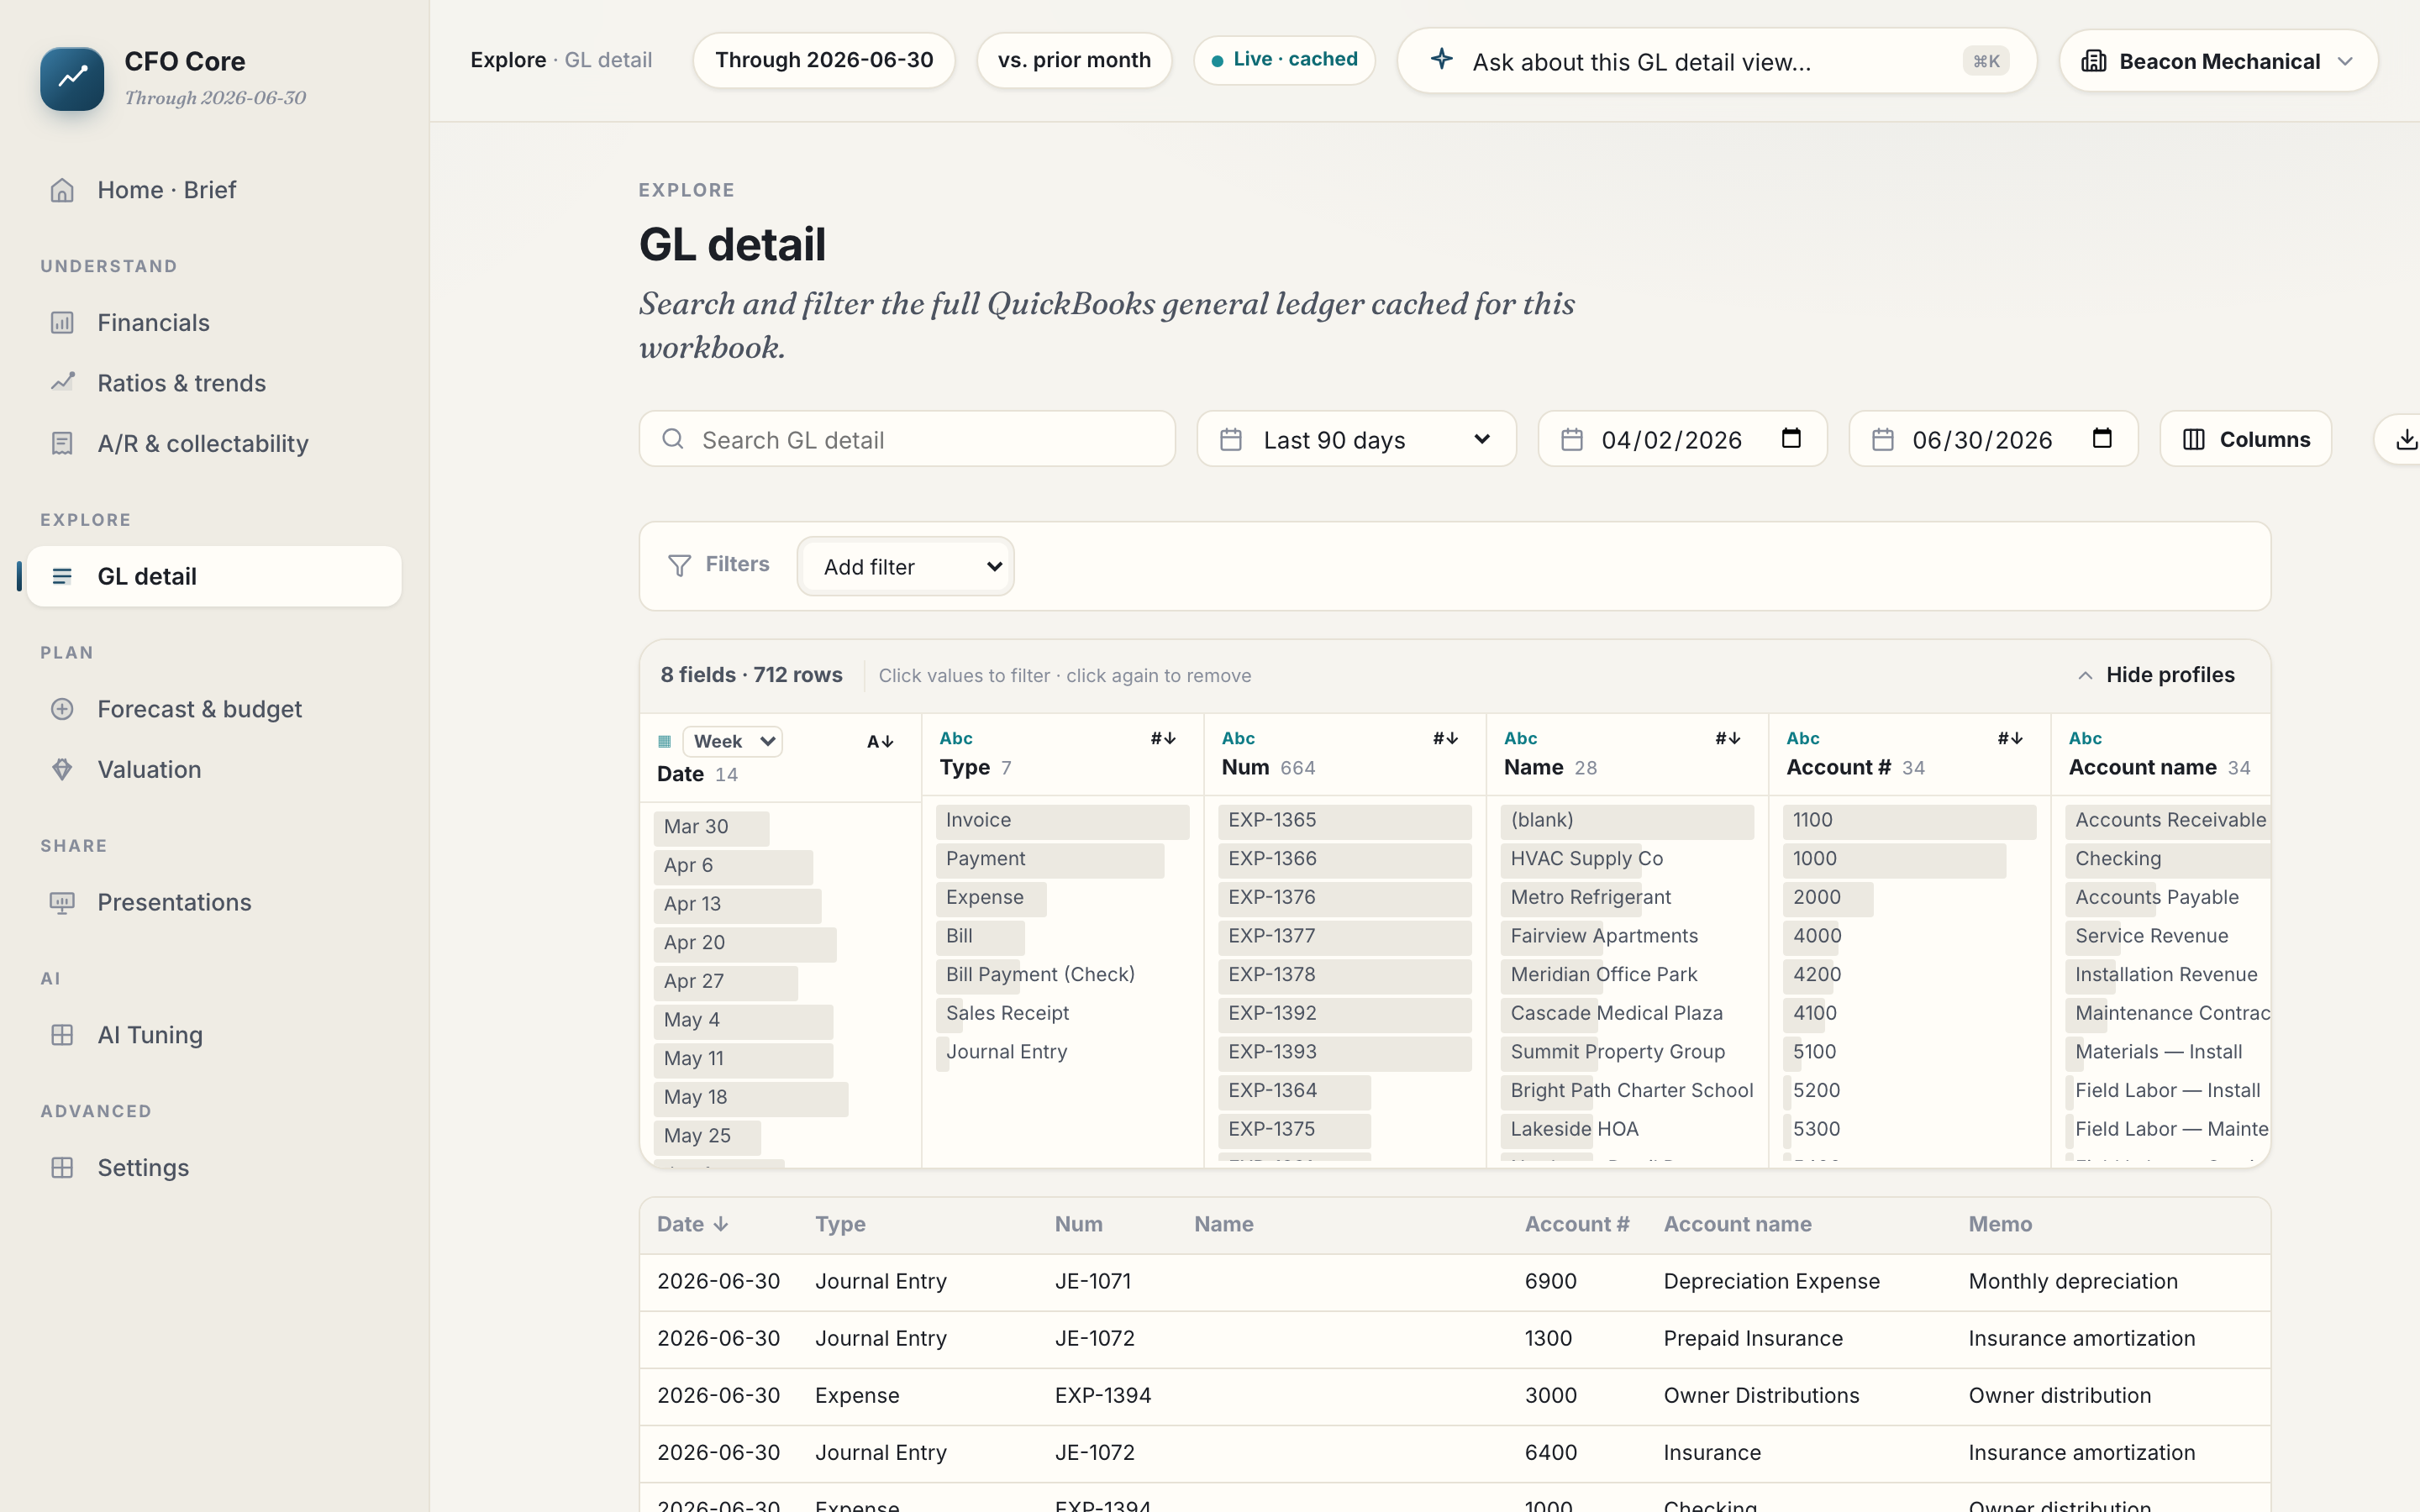
The whole ledger, searchable. Filter and facet every transaction — by account, vendor, customer, date, amount — then export exactly what's on screen, no more and no less. It's where every "click the number" lands, and it works just as well as a starting point when you already know what you're hunting.

The copilot

Ask in plain English — "Why did COGS go up this month?", "What did we spend on that job?" — and the answer arrives with its evidence cited: which accounts, which periods, which transactions. You can check its work, and you should. Every answer ends one click from the GL.

GL detail explorer — thousands of ledger rows, faceted by account, vendor, and amount — live product, sample data

Live product — sample data (Beacon Mechanical, a fictional company). Open this screen live — no signup →

And the thing it isn't: a person. The human CFO wins on judgment and negotiations. That's not what we sell. We sell the deliverables. The honest comparison →

How it works

The whole setup, honestly timed.

Real analysis needs your whole history, not a screen-scrape — so we're honest about the one wait involved.

Create your account

A minute of basics. No credit card.

2 min

Connect QuickBooks

Read-only, through Intuit's own consent screen. FuseGrid can never change your books.

60 seconds

We read 5 years of history

The full picture, not last quarter. We email you the moment your first Brief is ready.

a few hours — we email you

Open your first Brief

It already knows things. Most owners connect after dinner and read it with coffee.

every night after
Start tonight

This month is going to close either way. Close it with a CFO.

You've now seen the whole thing — every surface, one sample company, nothing withheld. The only tour left is the one on your own numbers.

Connect QuickBooks — free for 14 days →
Read-only · No credit card · 30-day money-back · Cancel anytime