The per-client deliverables — an annotated close, a 13-week cash forecast, A/R, a white-label board pack, a 24-month forecast and a valuation — plus the firm cockpit that reads your whole book overnight and tells you which clients need you. Drafted by AI, reviewed by you, every number traced to the ledger.
This is the full tour. The cockpit first, then everything you hand a client.
The cockpit reads every client's books overnight and ranks your whole roster by what needs a human — a margin that slipped, a close that's ready to send, a cash week worth a call, an uncategorized balance before you sign off. One click opens that client's full CFO workspace. No more opening twenty workbooks to find the one that matters.
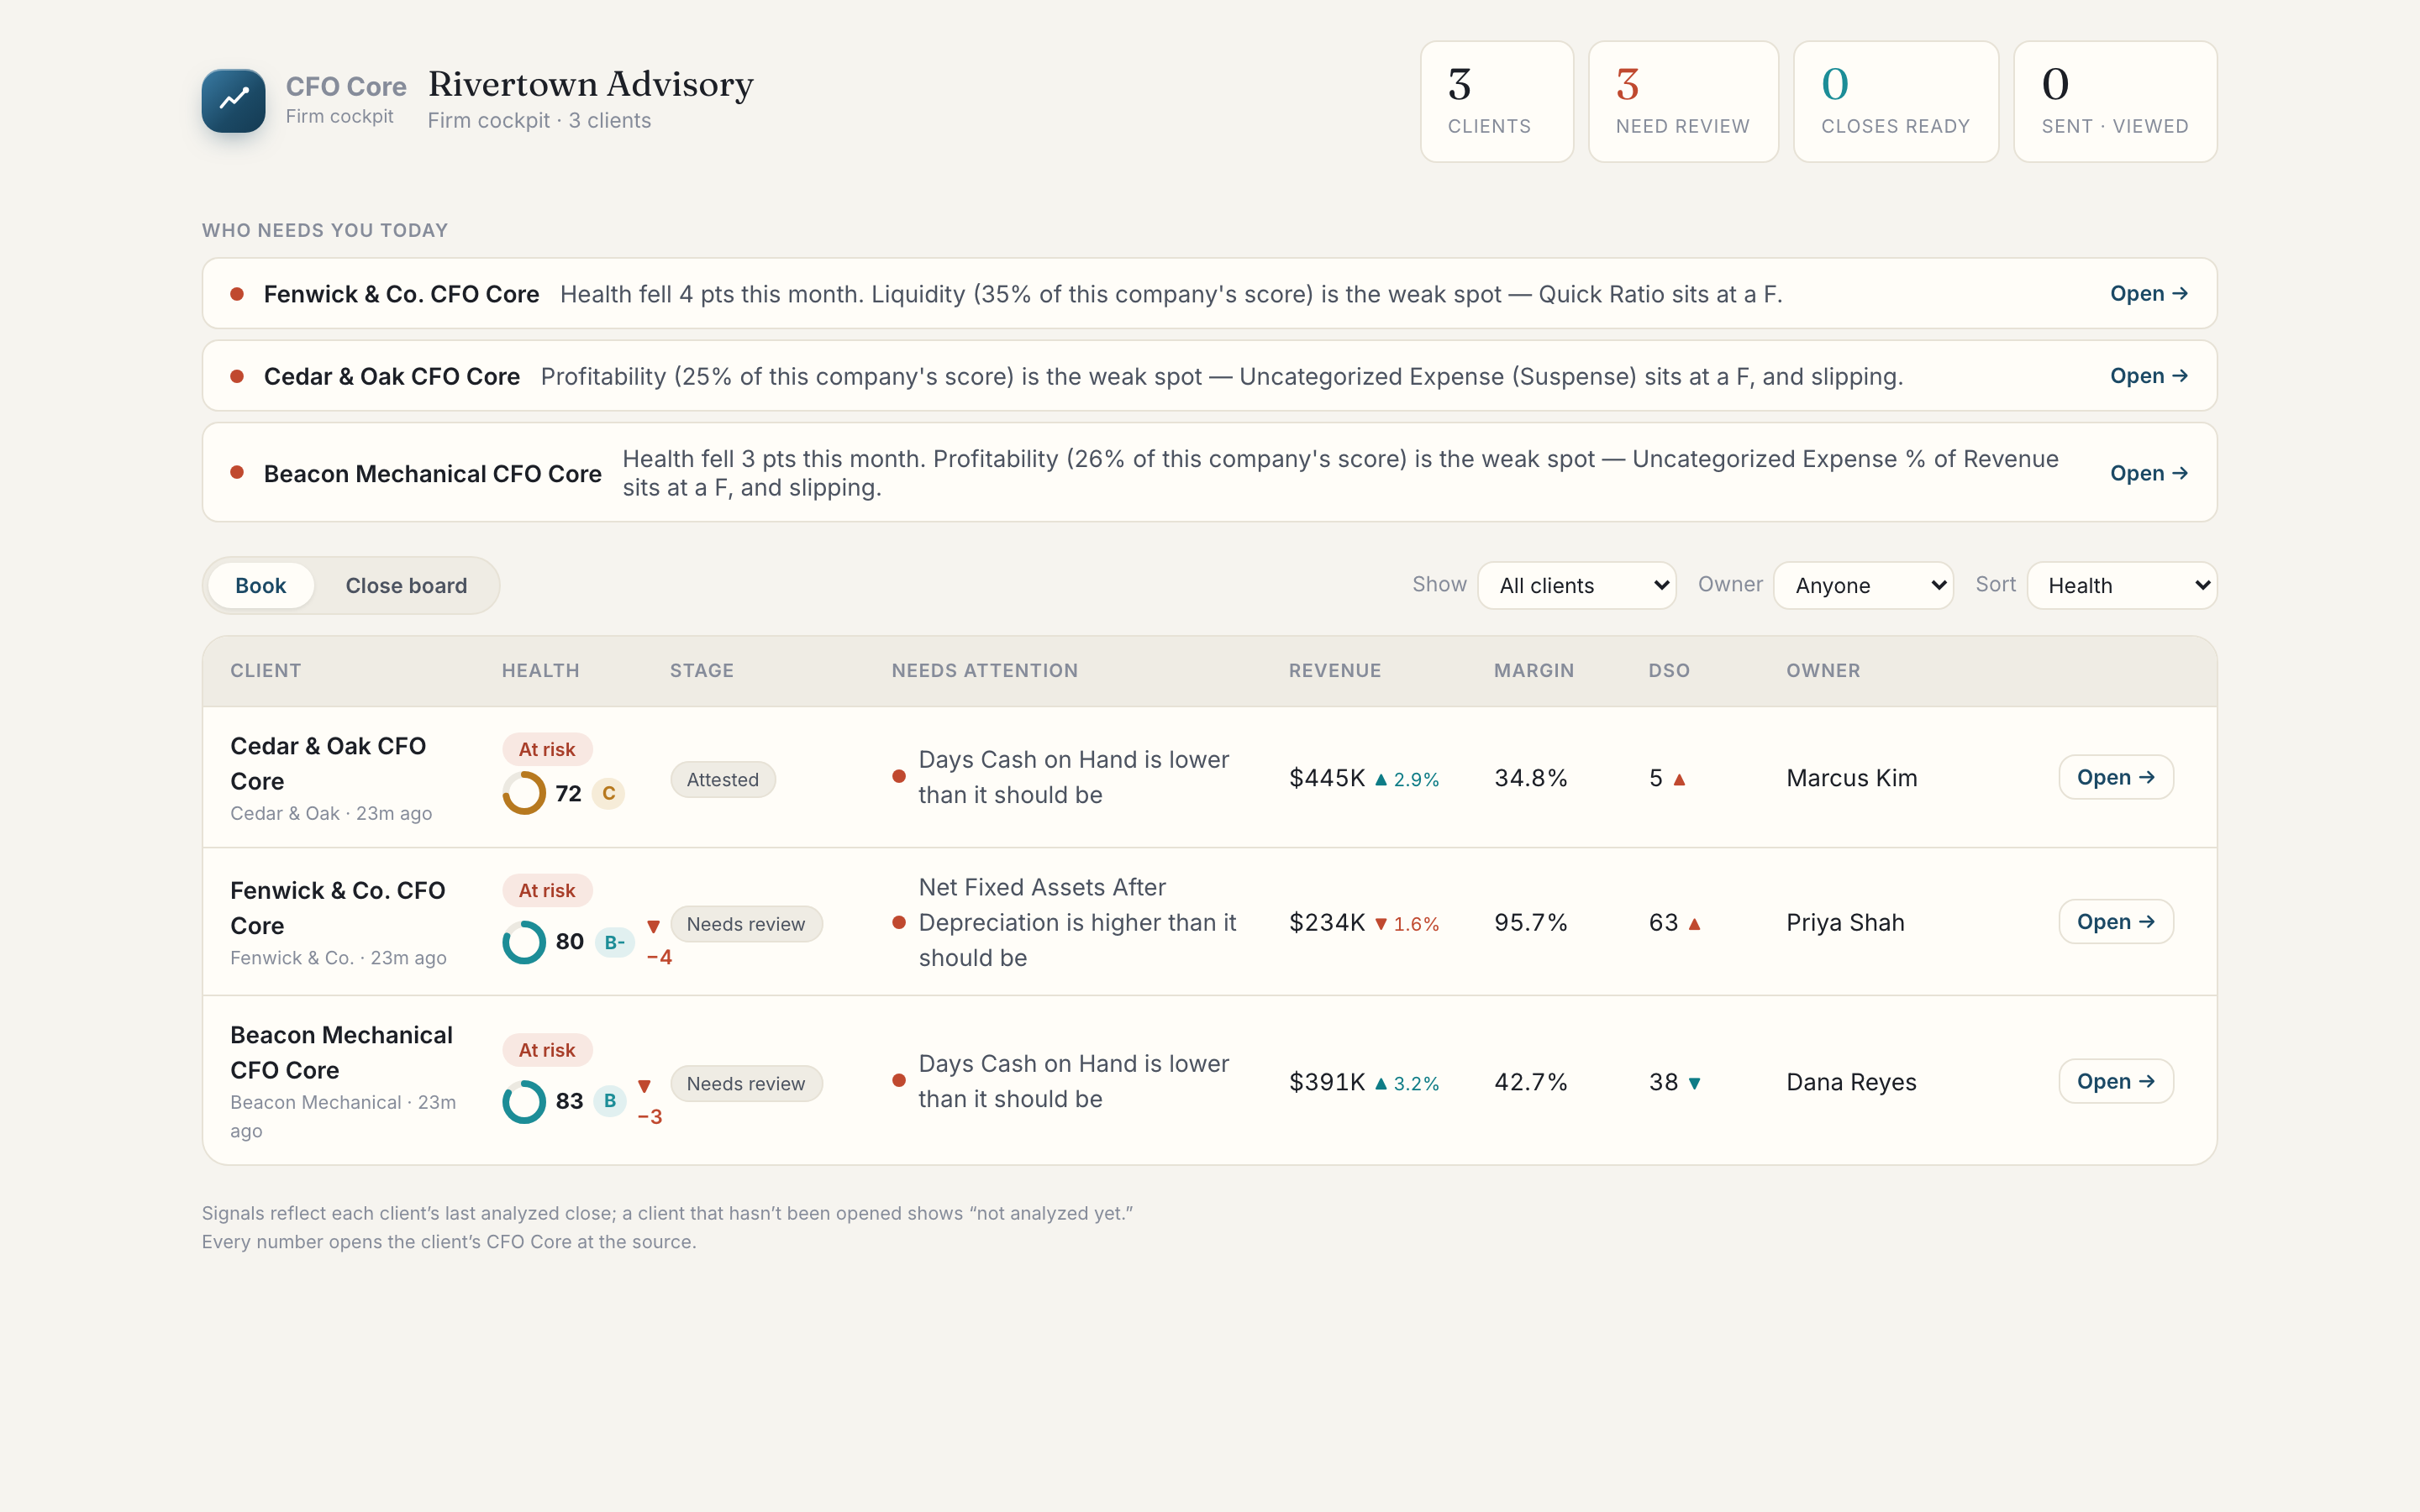
Live product — sample data (Rivertown Advisory, a fictional firm). Open this screen live — no signup →
The name and what they do — so the number in the next column reads in context. A 41-day DSO means something different for an HVAC contractor than for a law firm.
When the books last came through — "2h ago," or "Stale 6d" when a client needs to reconnect. You never advise off numbers you didn't know were old.
A 0–100 score with a letter grade that rolls the client's ratios into one read, plus where the close sits. Beacon reads 83 (B) and needs review; Fenwick, 71 (C) with $18K still uncategorized.
The single most important thing this month, colour-coded by severity. "Gross margin −4.5 pts · Install" (bad). "$18K uncategorized" (check). One flag, not a firehose.
OK, Watch, or At risk — a client whose 13-week forecast dips is At risk before the week arrives, while there's still time to make the call.
Days sales outstanding with an arrow. Beacon's 41 ▲ — up five days in a month — tells you which books are slowing before the client feels it.
Sort by needs-review, severity, staleness, or health score. Filter to just the clients needing review or the ones gone stale. You spend Monday on the clients that need judgment, not the ones that are fine.
"Open" deep-links straight into that client's full CFO workspace — the annotated close, the cash forecast, the board pack, the copilot. The cockpit is triage; the workspace is where you do the work.
Not in the cockpit yet — and we won't pretend otherwise: per-client billing or profitability, staff and engagement assignment, a client-facing portal, white-label at portfolio scale, bulk "send the close" actions, and real-time alerts. Those are on the roadmap.
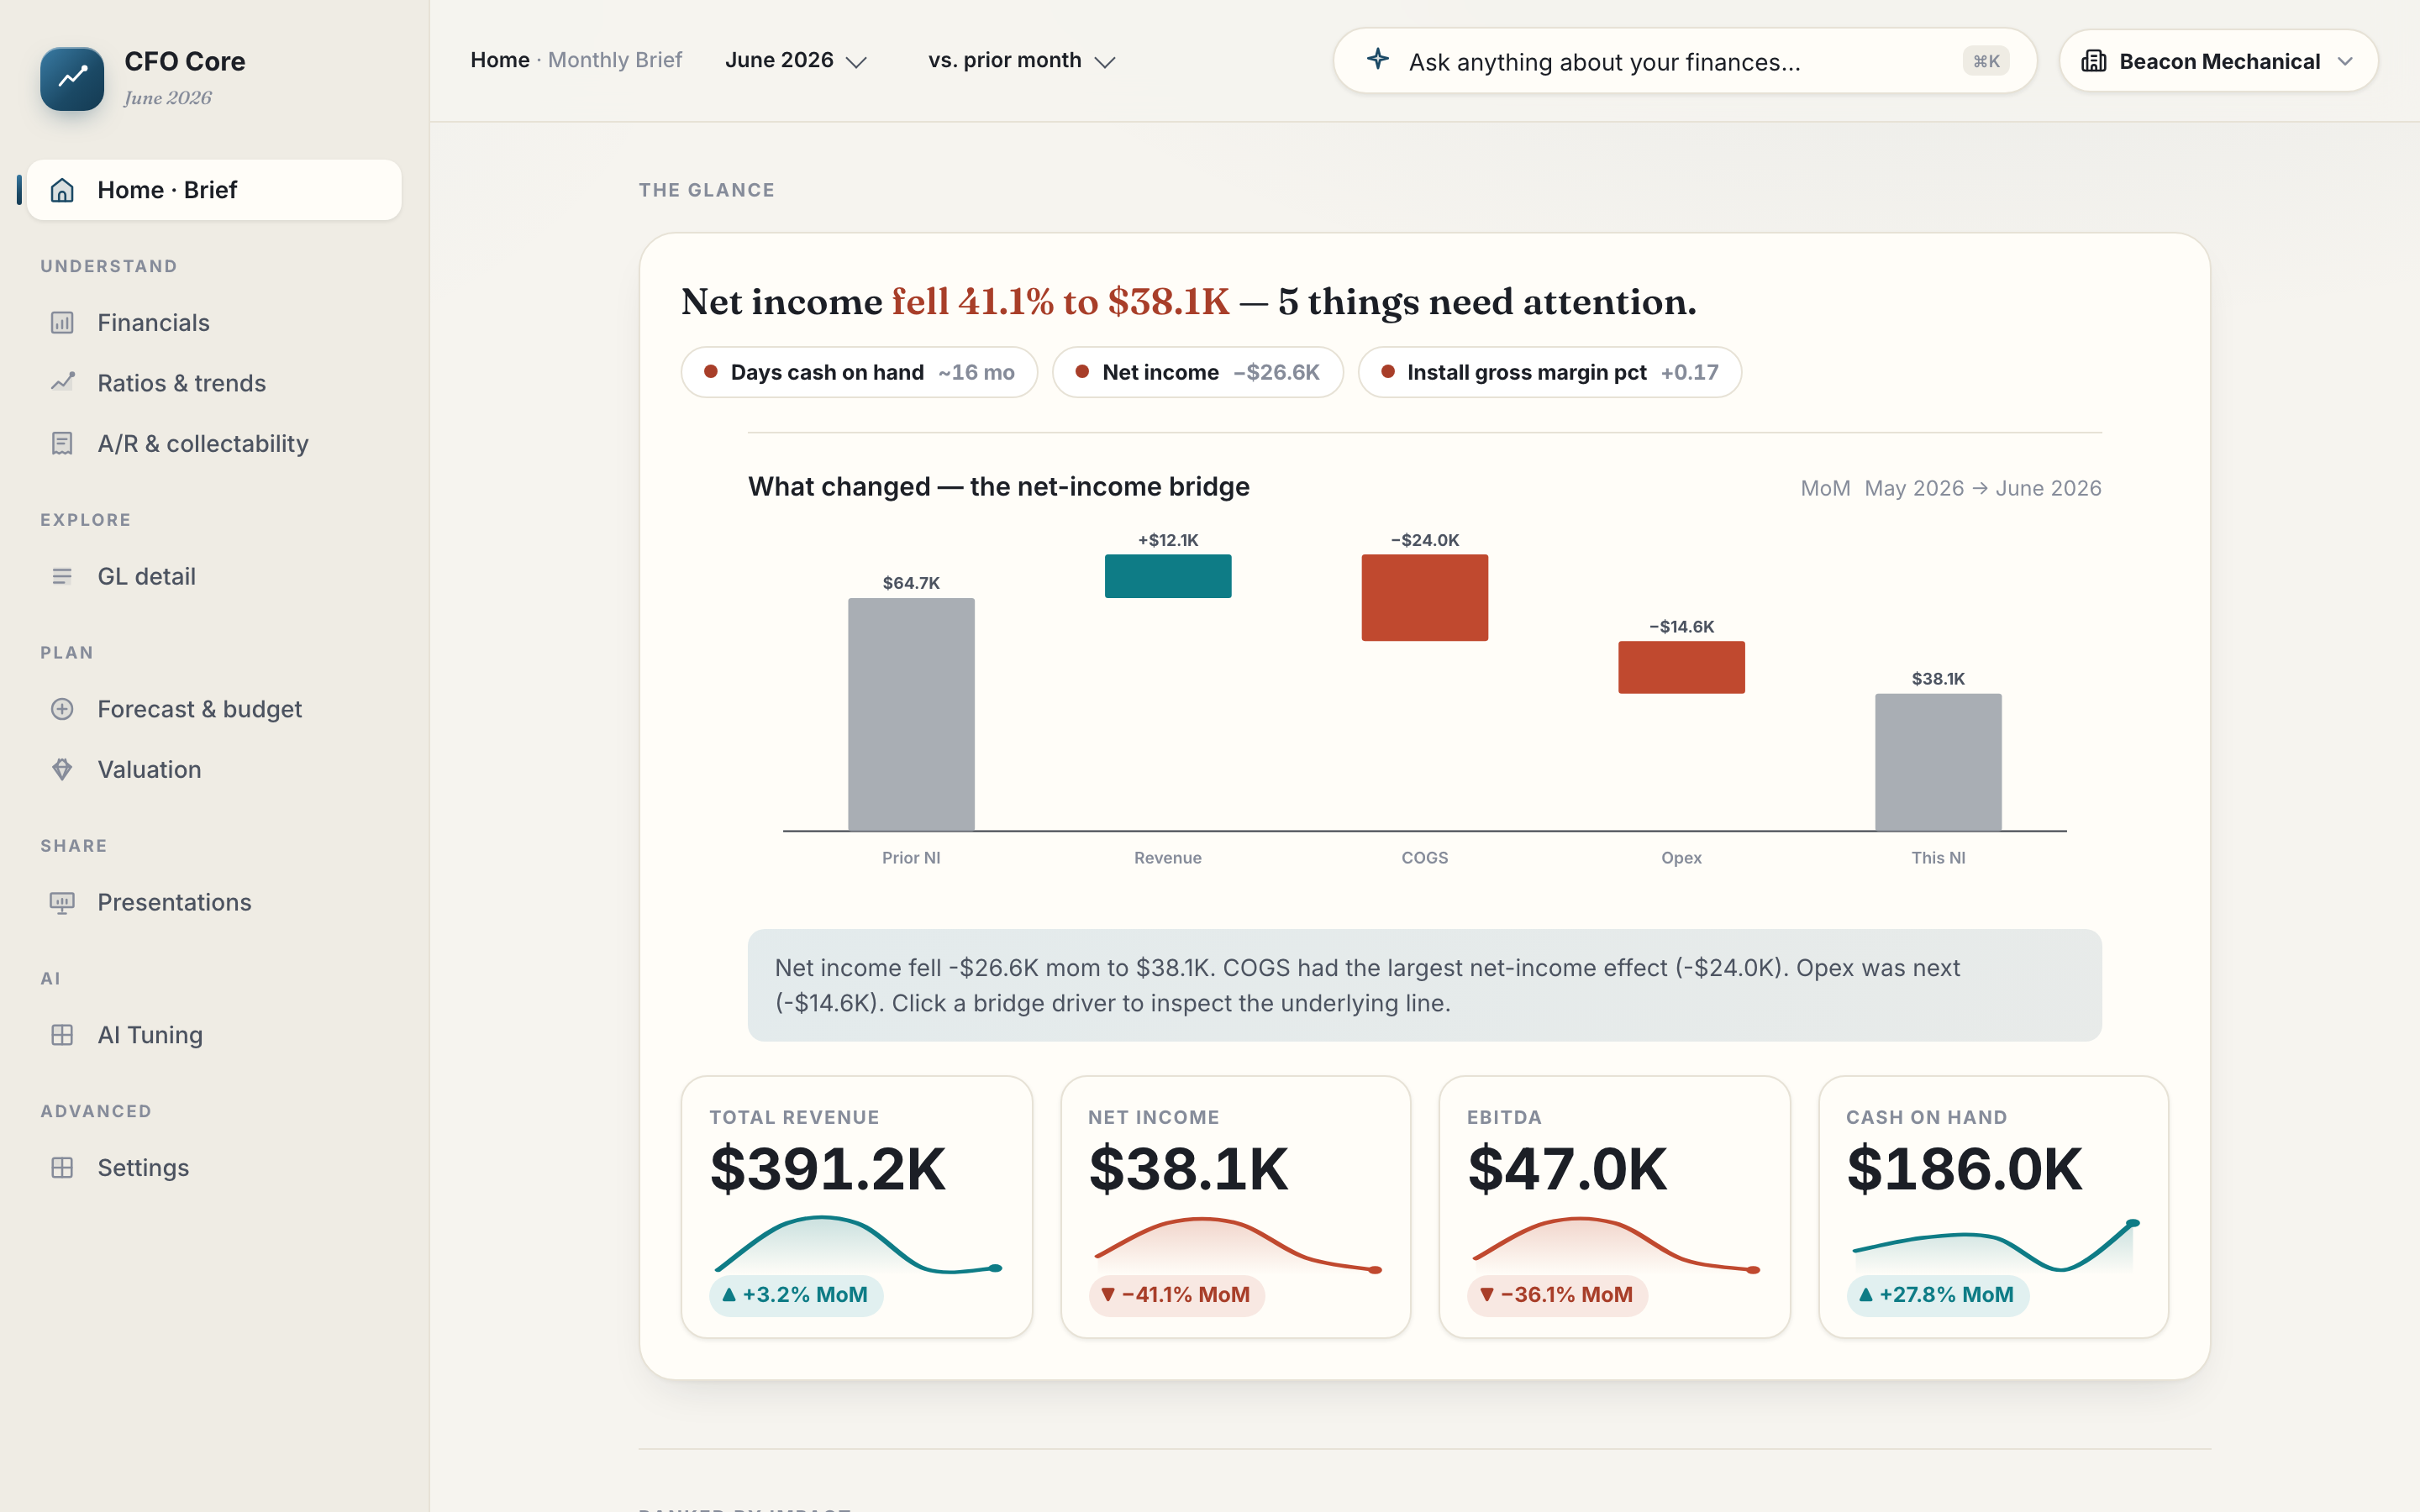
Open any client from the cockpit and this is the workspace. Every deliverable is drafted from that client's real QuickBooks, waiting for your review, and carries your firm's name — not ours. Beacon Mechanical, one of Rivertown's clients, runs through all of them.
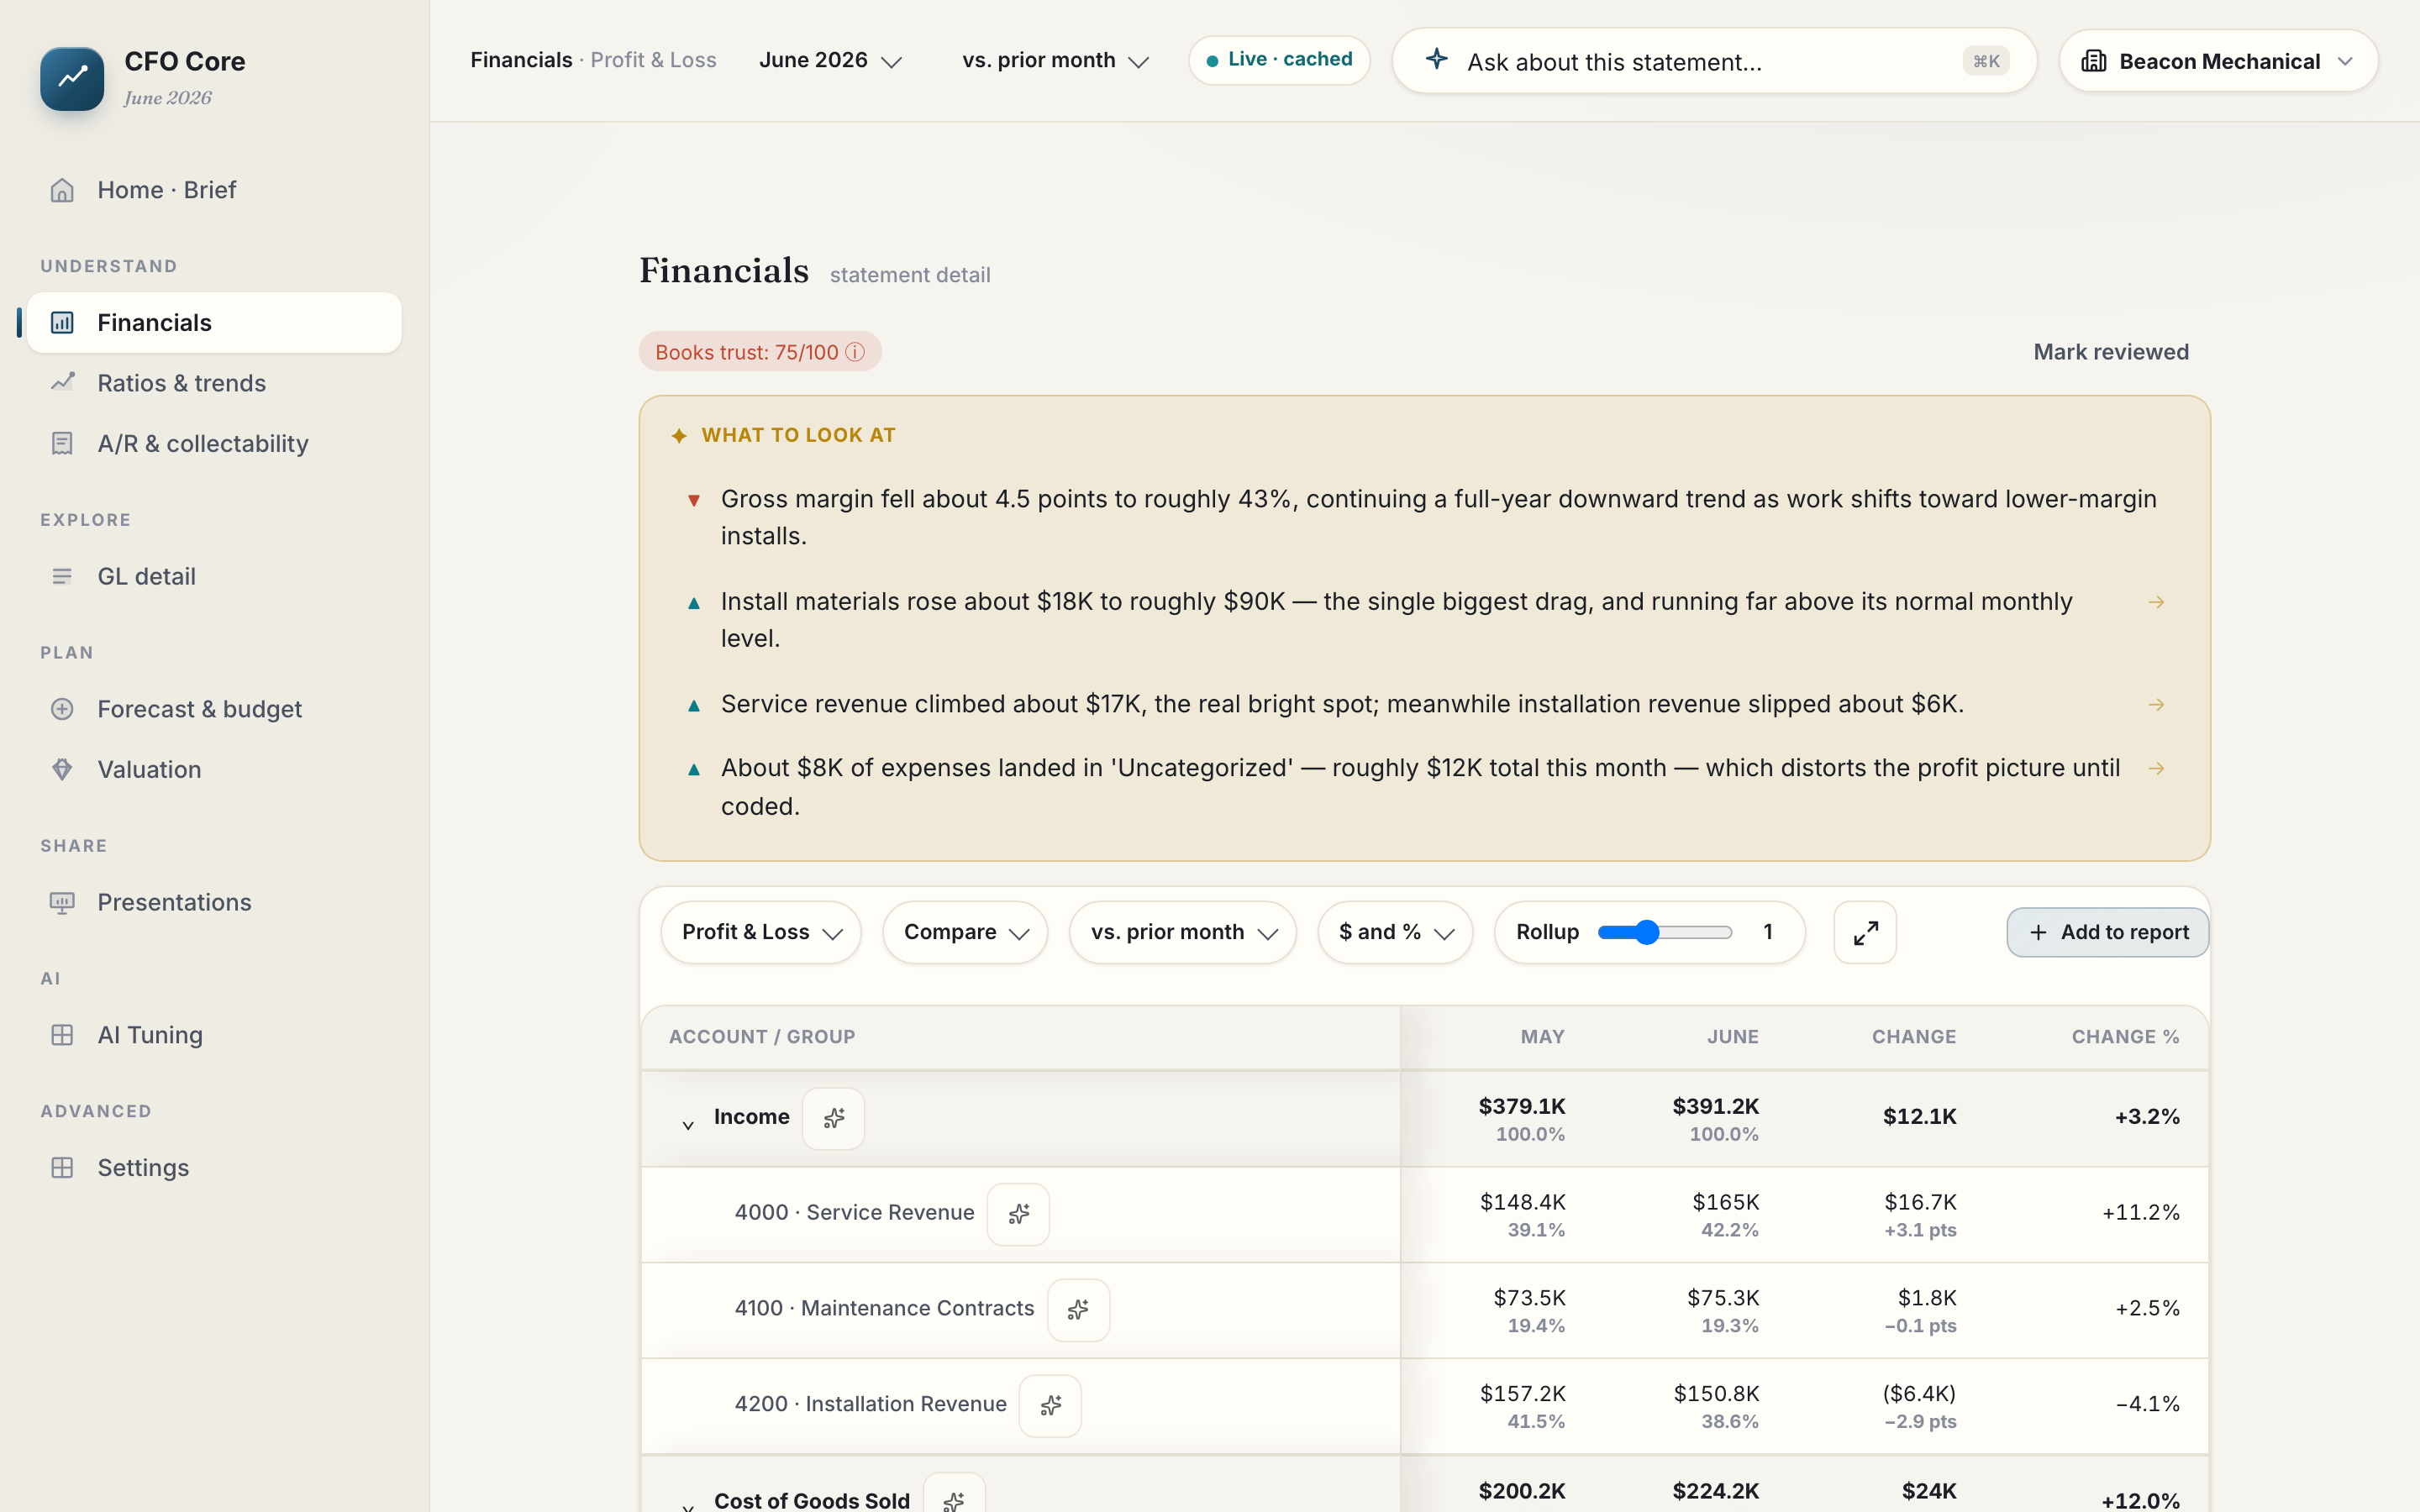
Each close, FuseGrid writes What stood out across the top of the client's statements, then flags the lines that earned a second look: statistical outliers against the client's own history, accounts that flipped sign, journal entries that land on suspiciously round numbers. It knows materiality — a $40,000 account going quiet is a finding; a $40 one is silence you paid for. And a Books-Trust check catches the mess — uncategorized balances, a missing accrual — before you put your name on the close.
Beacon's June: net income fell 41% after a rising three-month run — Install materials on one builder's job took gross margin down 4.5 points. You caught it before the client asked.
Hand this to a client, on your letterhead
Live product — sample data (Rivertown Advisory, a fictional firm). Open this screen live — no signup →
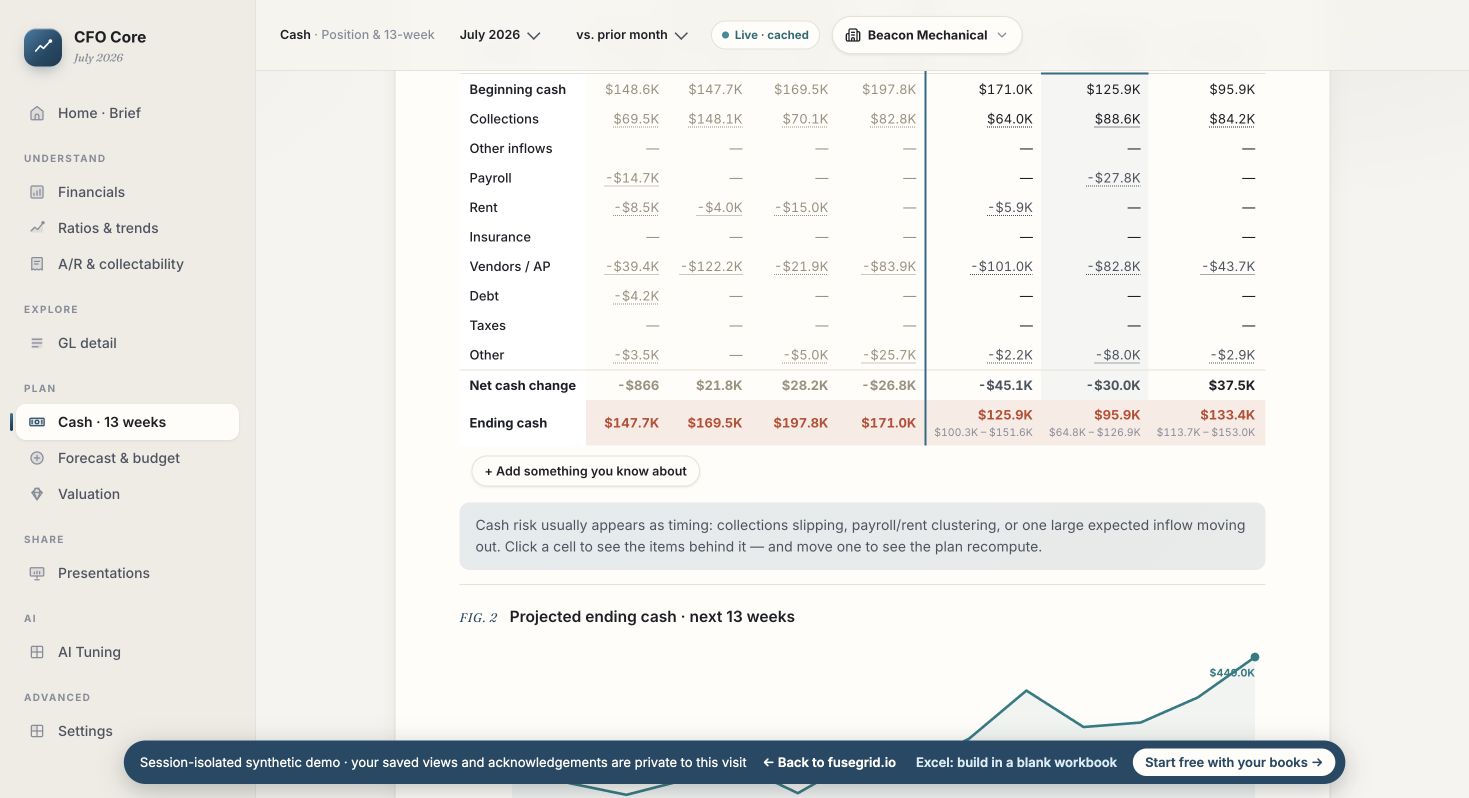
The cash model is timing-aware: it learns the client's payroll rhythm, the quarterly premiums, and when each customer actually pays — not just when they're due. So a tight week shows up while it's still weeks away and fixable, with the cause named. That's the payroll-week call you make before the client asks you to make it.
The tight week is usually two things landing together — payroll and a premium. The fix is a phone call, made in week 1.
See the live cash model — no signup
The live cash model, daily to monthly (sample data — Beacon Mechanical, a fictional company). A dedicated 13-week planning table is on the roadmap. Open it live →
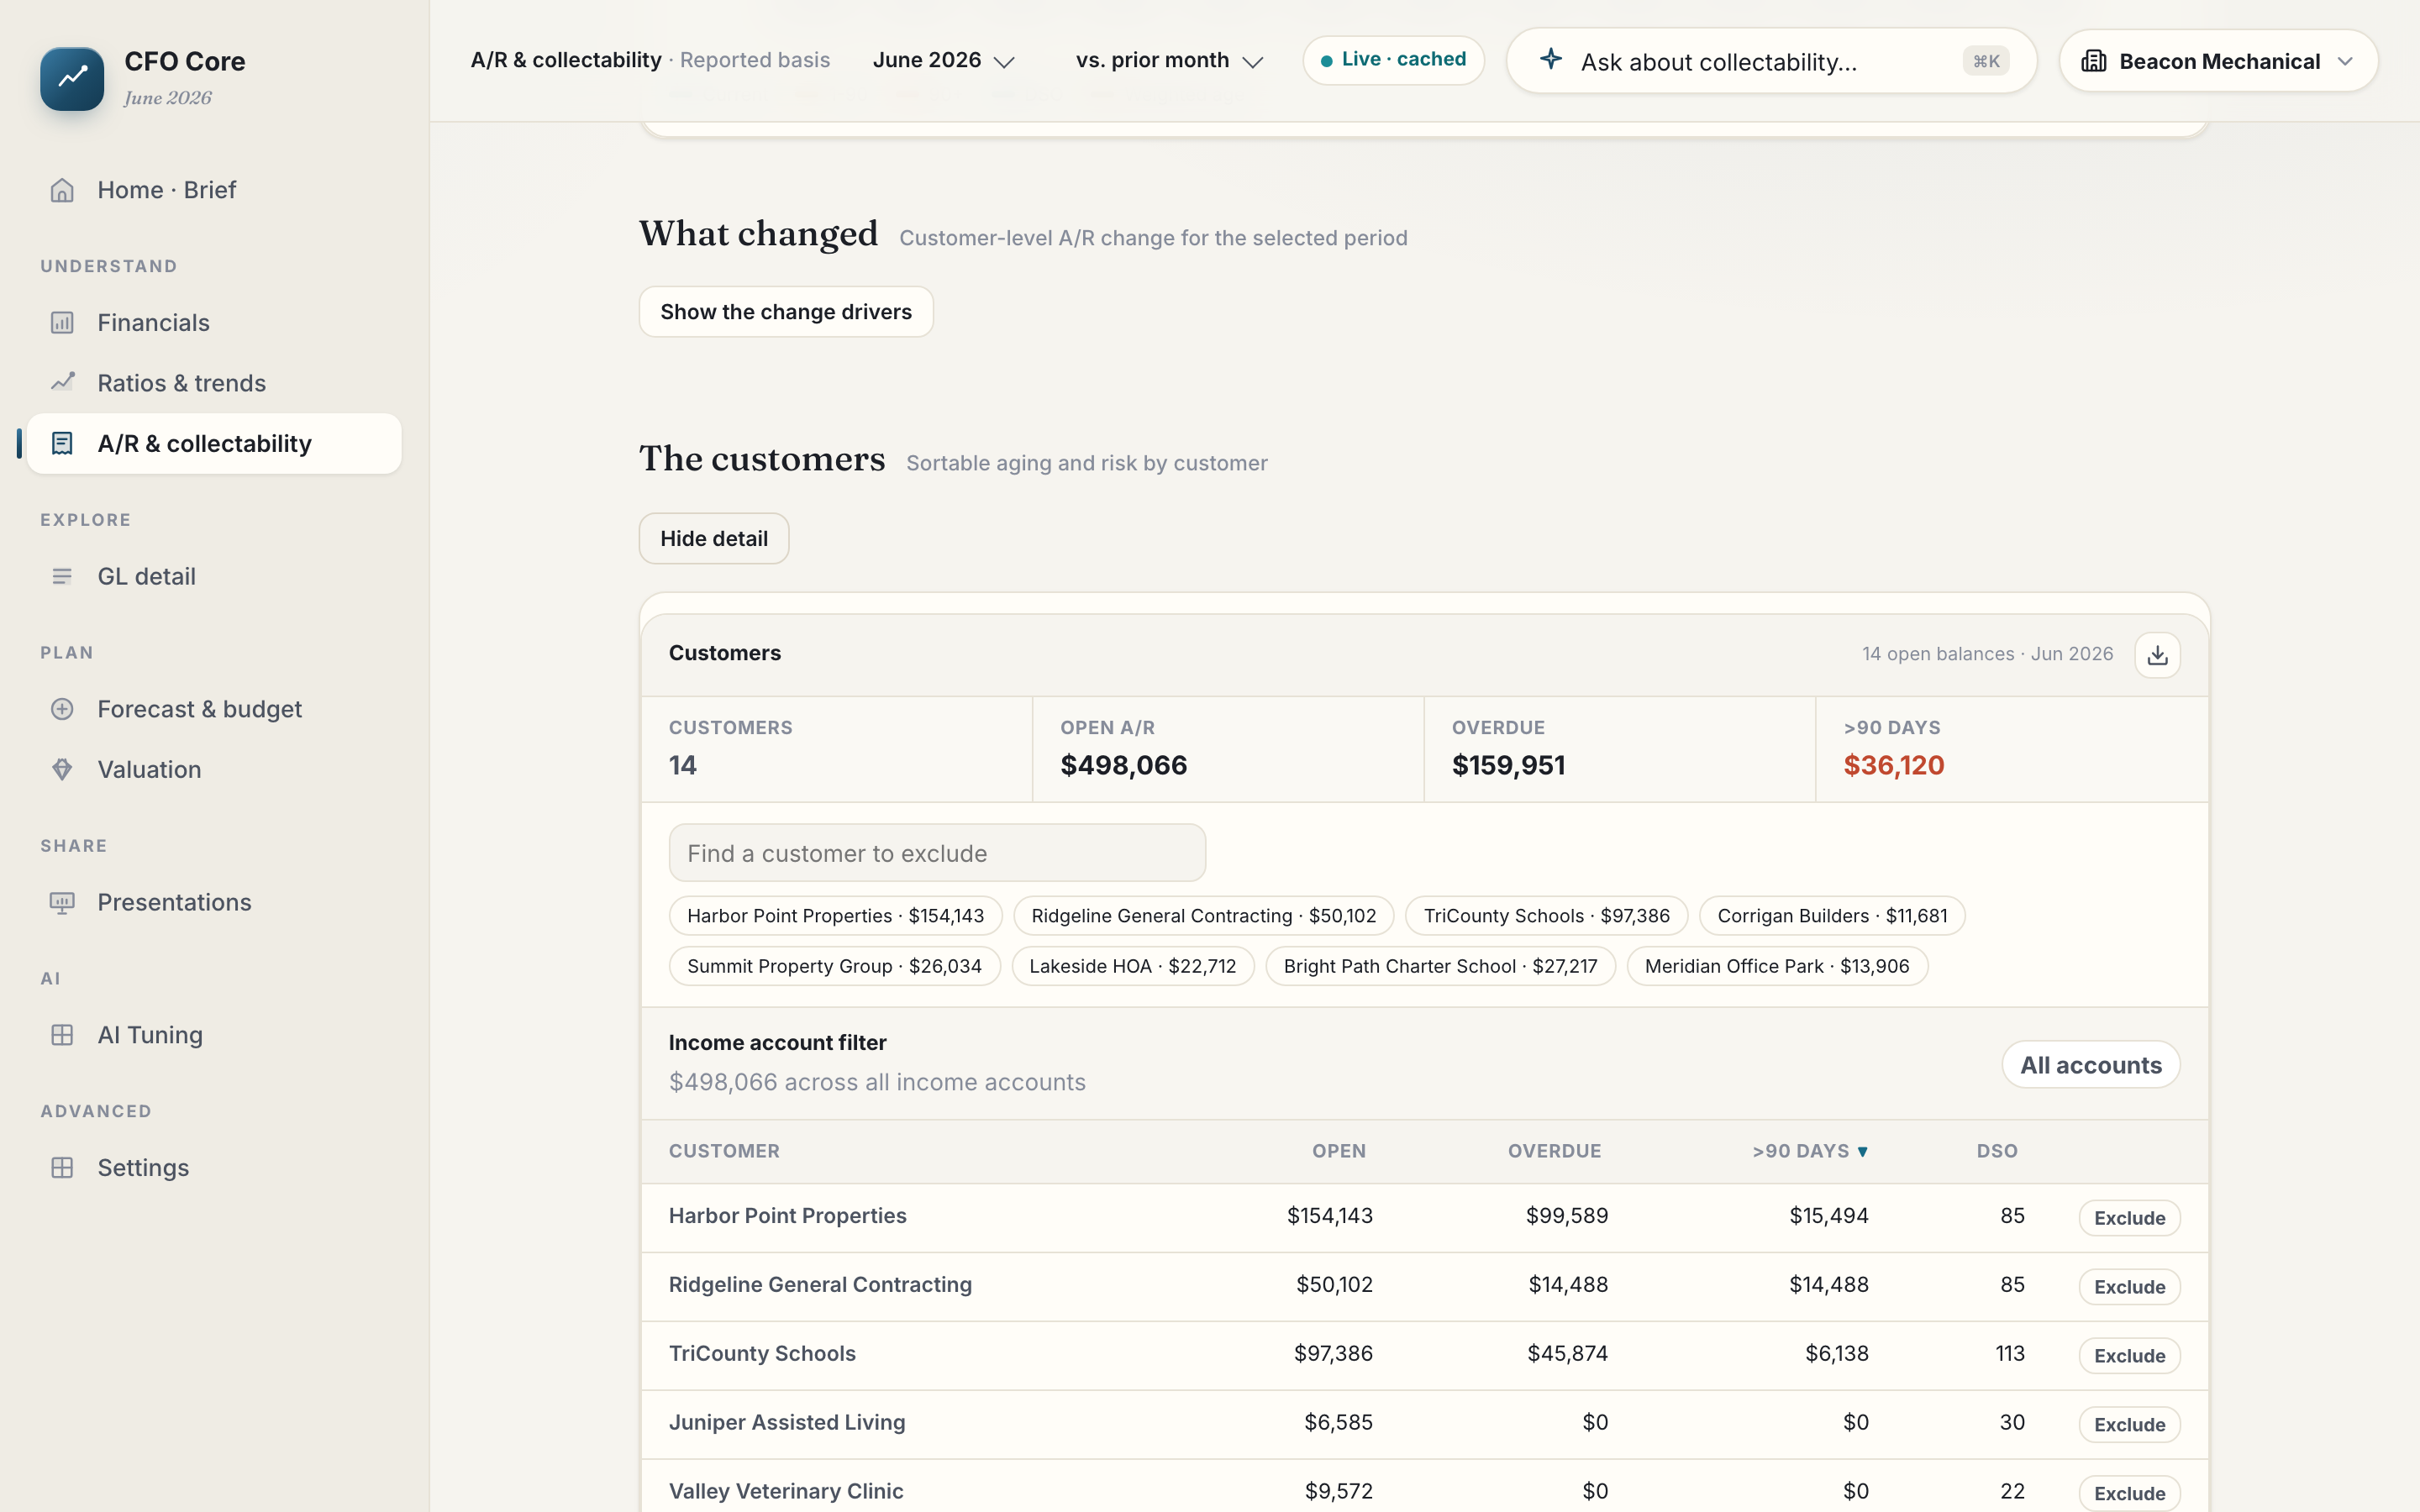
DSO is a number; the collections call is the deliverable. FuseGrid ages the client's receivables, then names the three customers who actually slowed — in who-to-call-first order, each with the open balance and how far past their own pattern they've drifted. It shows the full aged detail behind every balance, so you know which to chase and which to reserve against.
Beacon's DSO drifted up about five days this month, to roughly 41. Three customers — Harbor Point, TriCounty Schools, Ridgeline — carry most of the half-million outstanding, and one phone list fixes the cash story a chapter up.
Hand the client a call list, not a chart
Live product — sample data (Rivertown Advisory, a fictional firm). Open this screen live — no signup →
Pin the numbers that matter, let AI draft the narrative in a CFO's voice, and export a white-label deck — your logo on the cover, your name in the footer — or send a no-login share link the client's board can open on a phone. White-label is included in the partner plan, so what lands in the client's inbox looks like it came from a CFO on your staff. From a lost weekend to eleven minutes.
The share link is revocable — you send it, you can pull it. Your brand, your control, your client relationship.
Put your logo on the board packJune revenue rose 3.2% to $391.2K; the story is margin — down 4.5 points to 42.7% on Install materials — taking net income down 41% to $38.1K. Cash is $186K. Collections slowed: DSO drifted up about five days, to roughly 41.
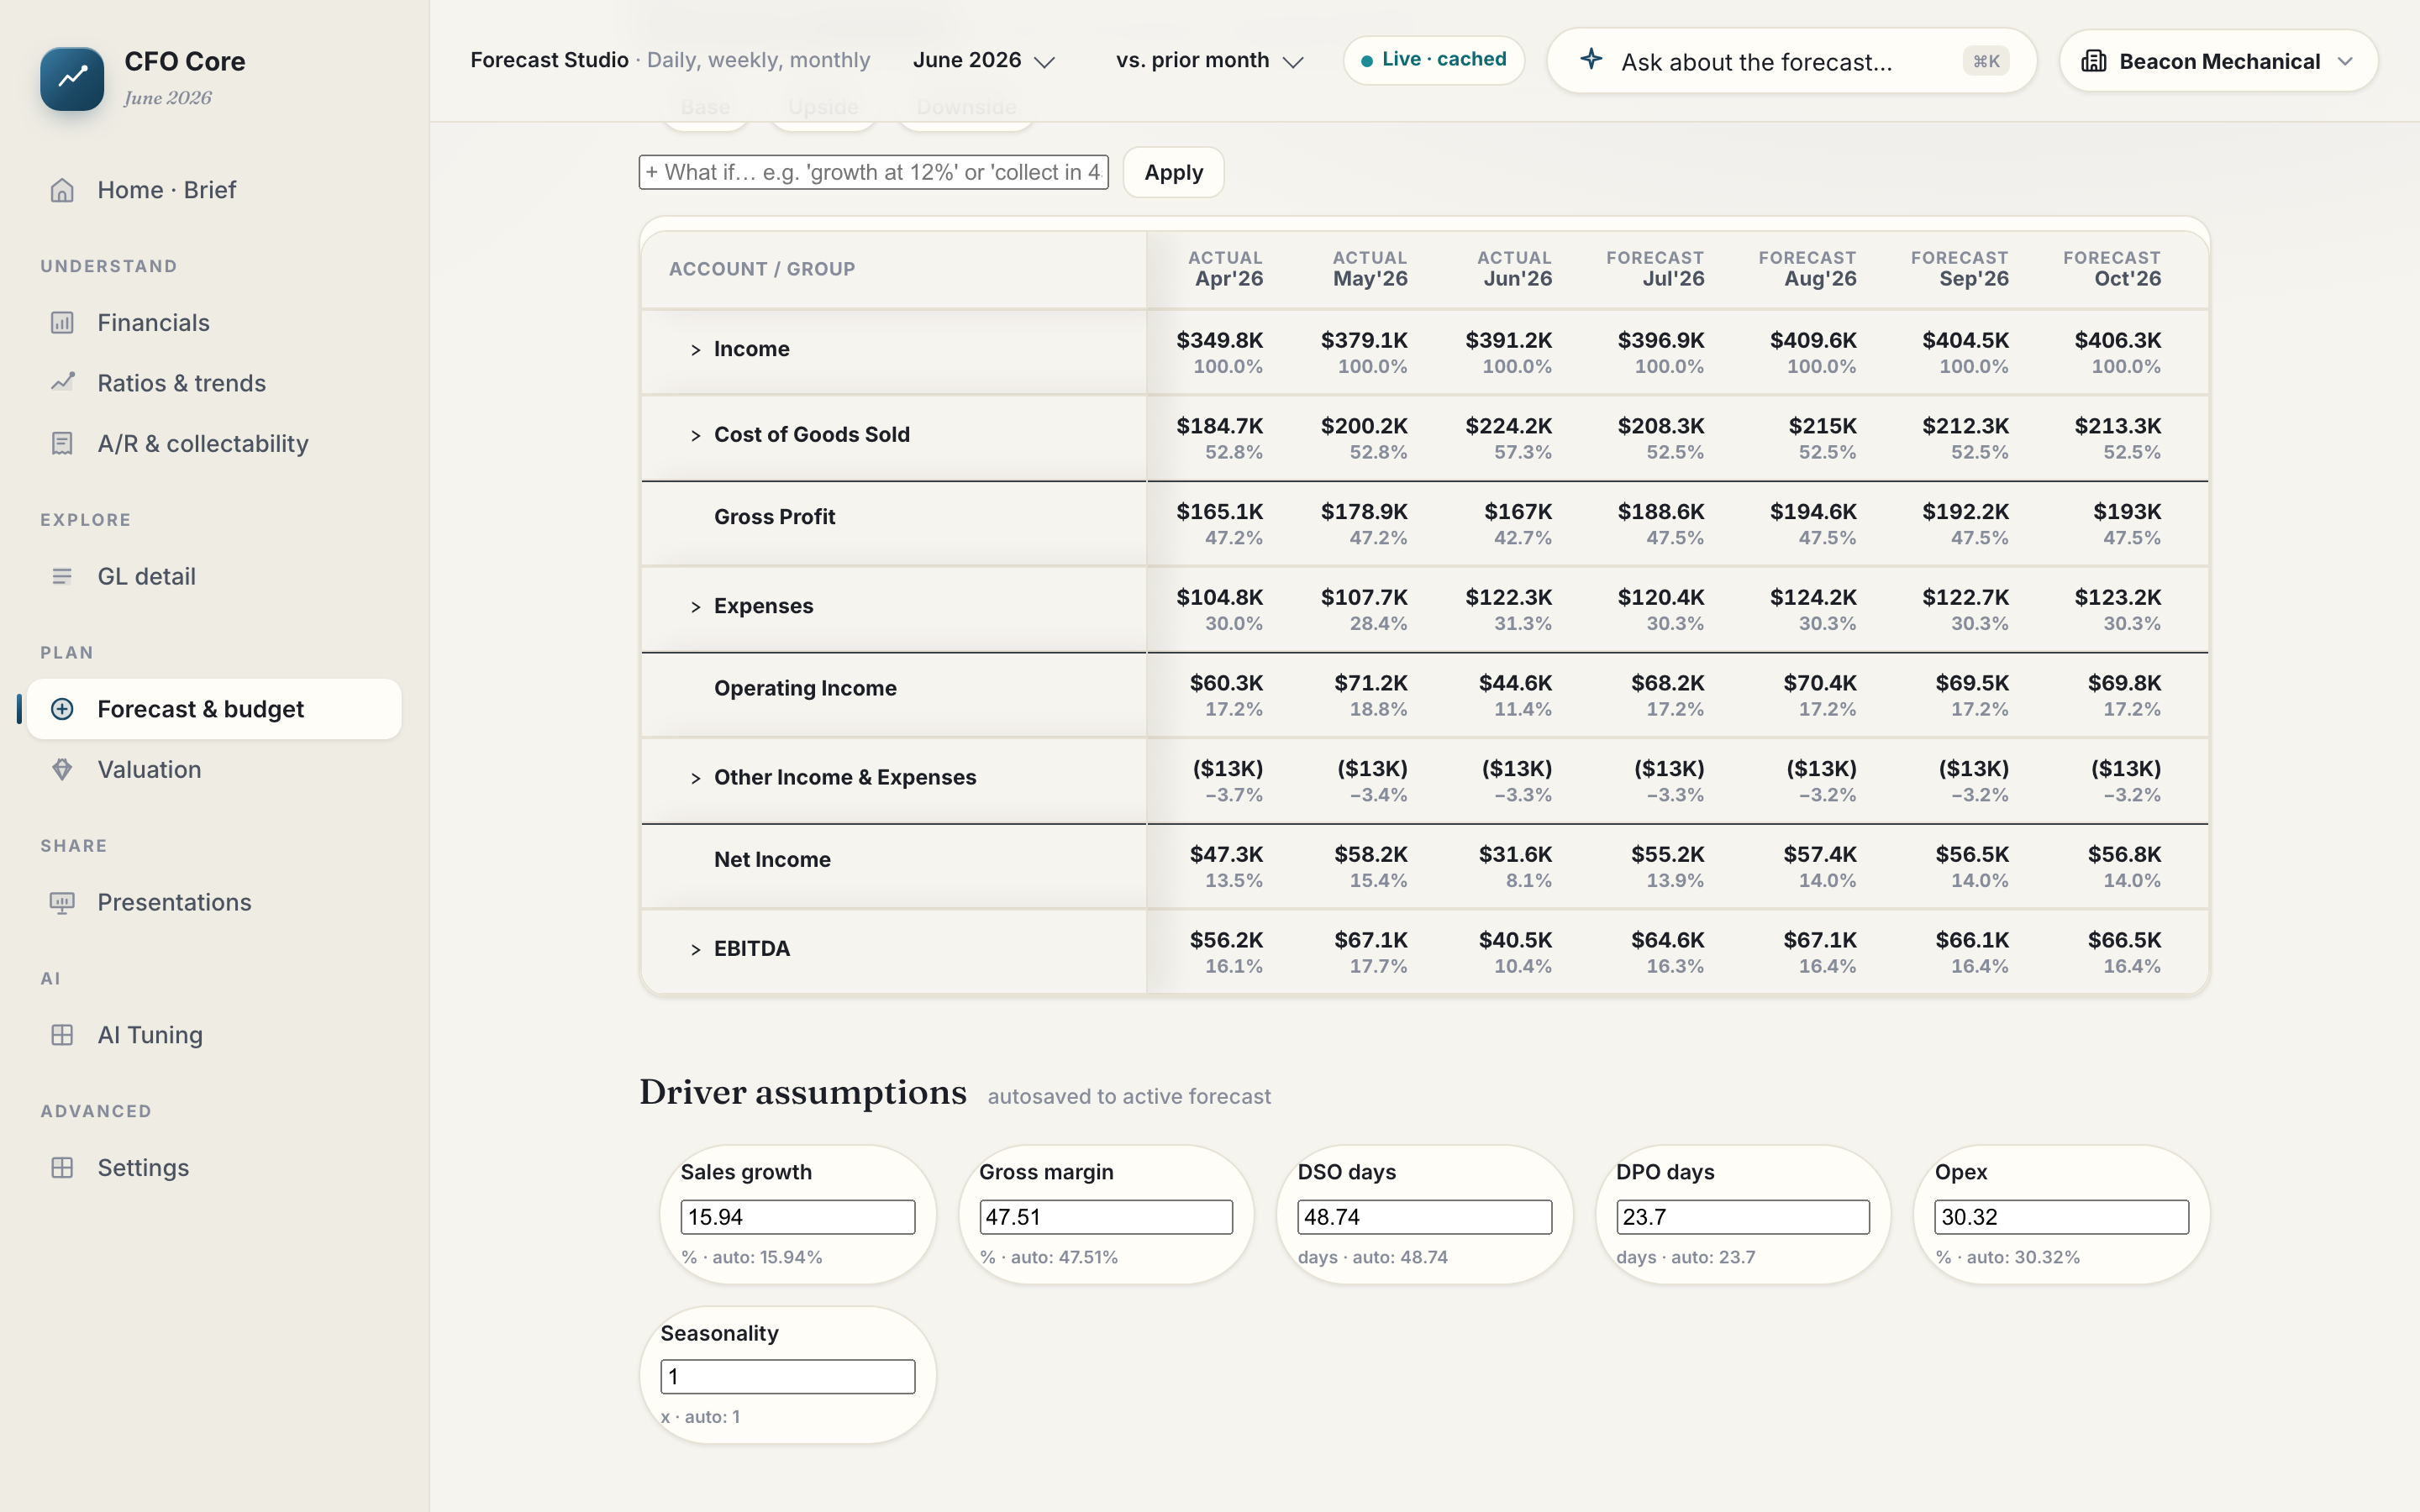
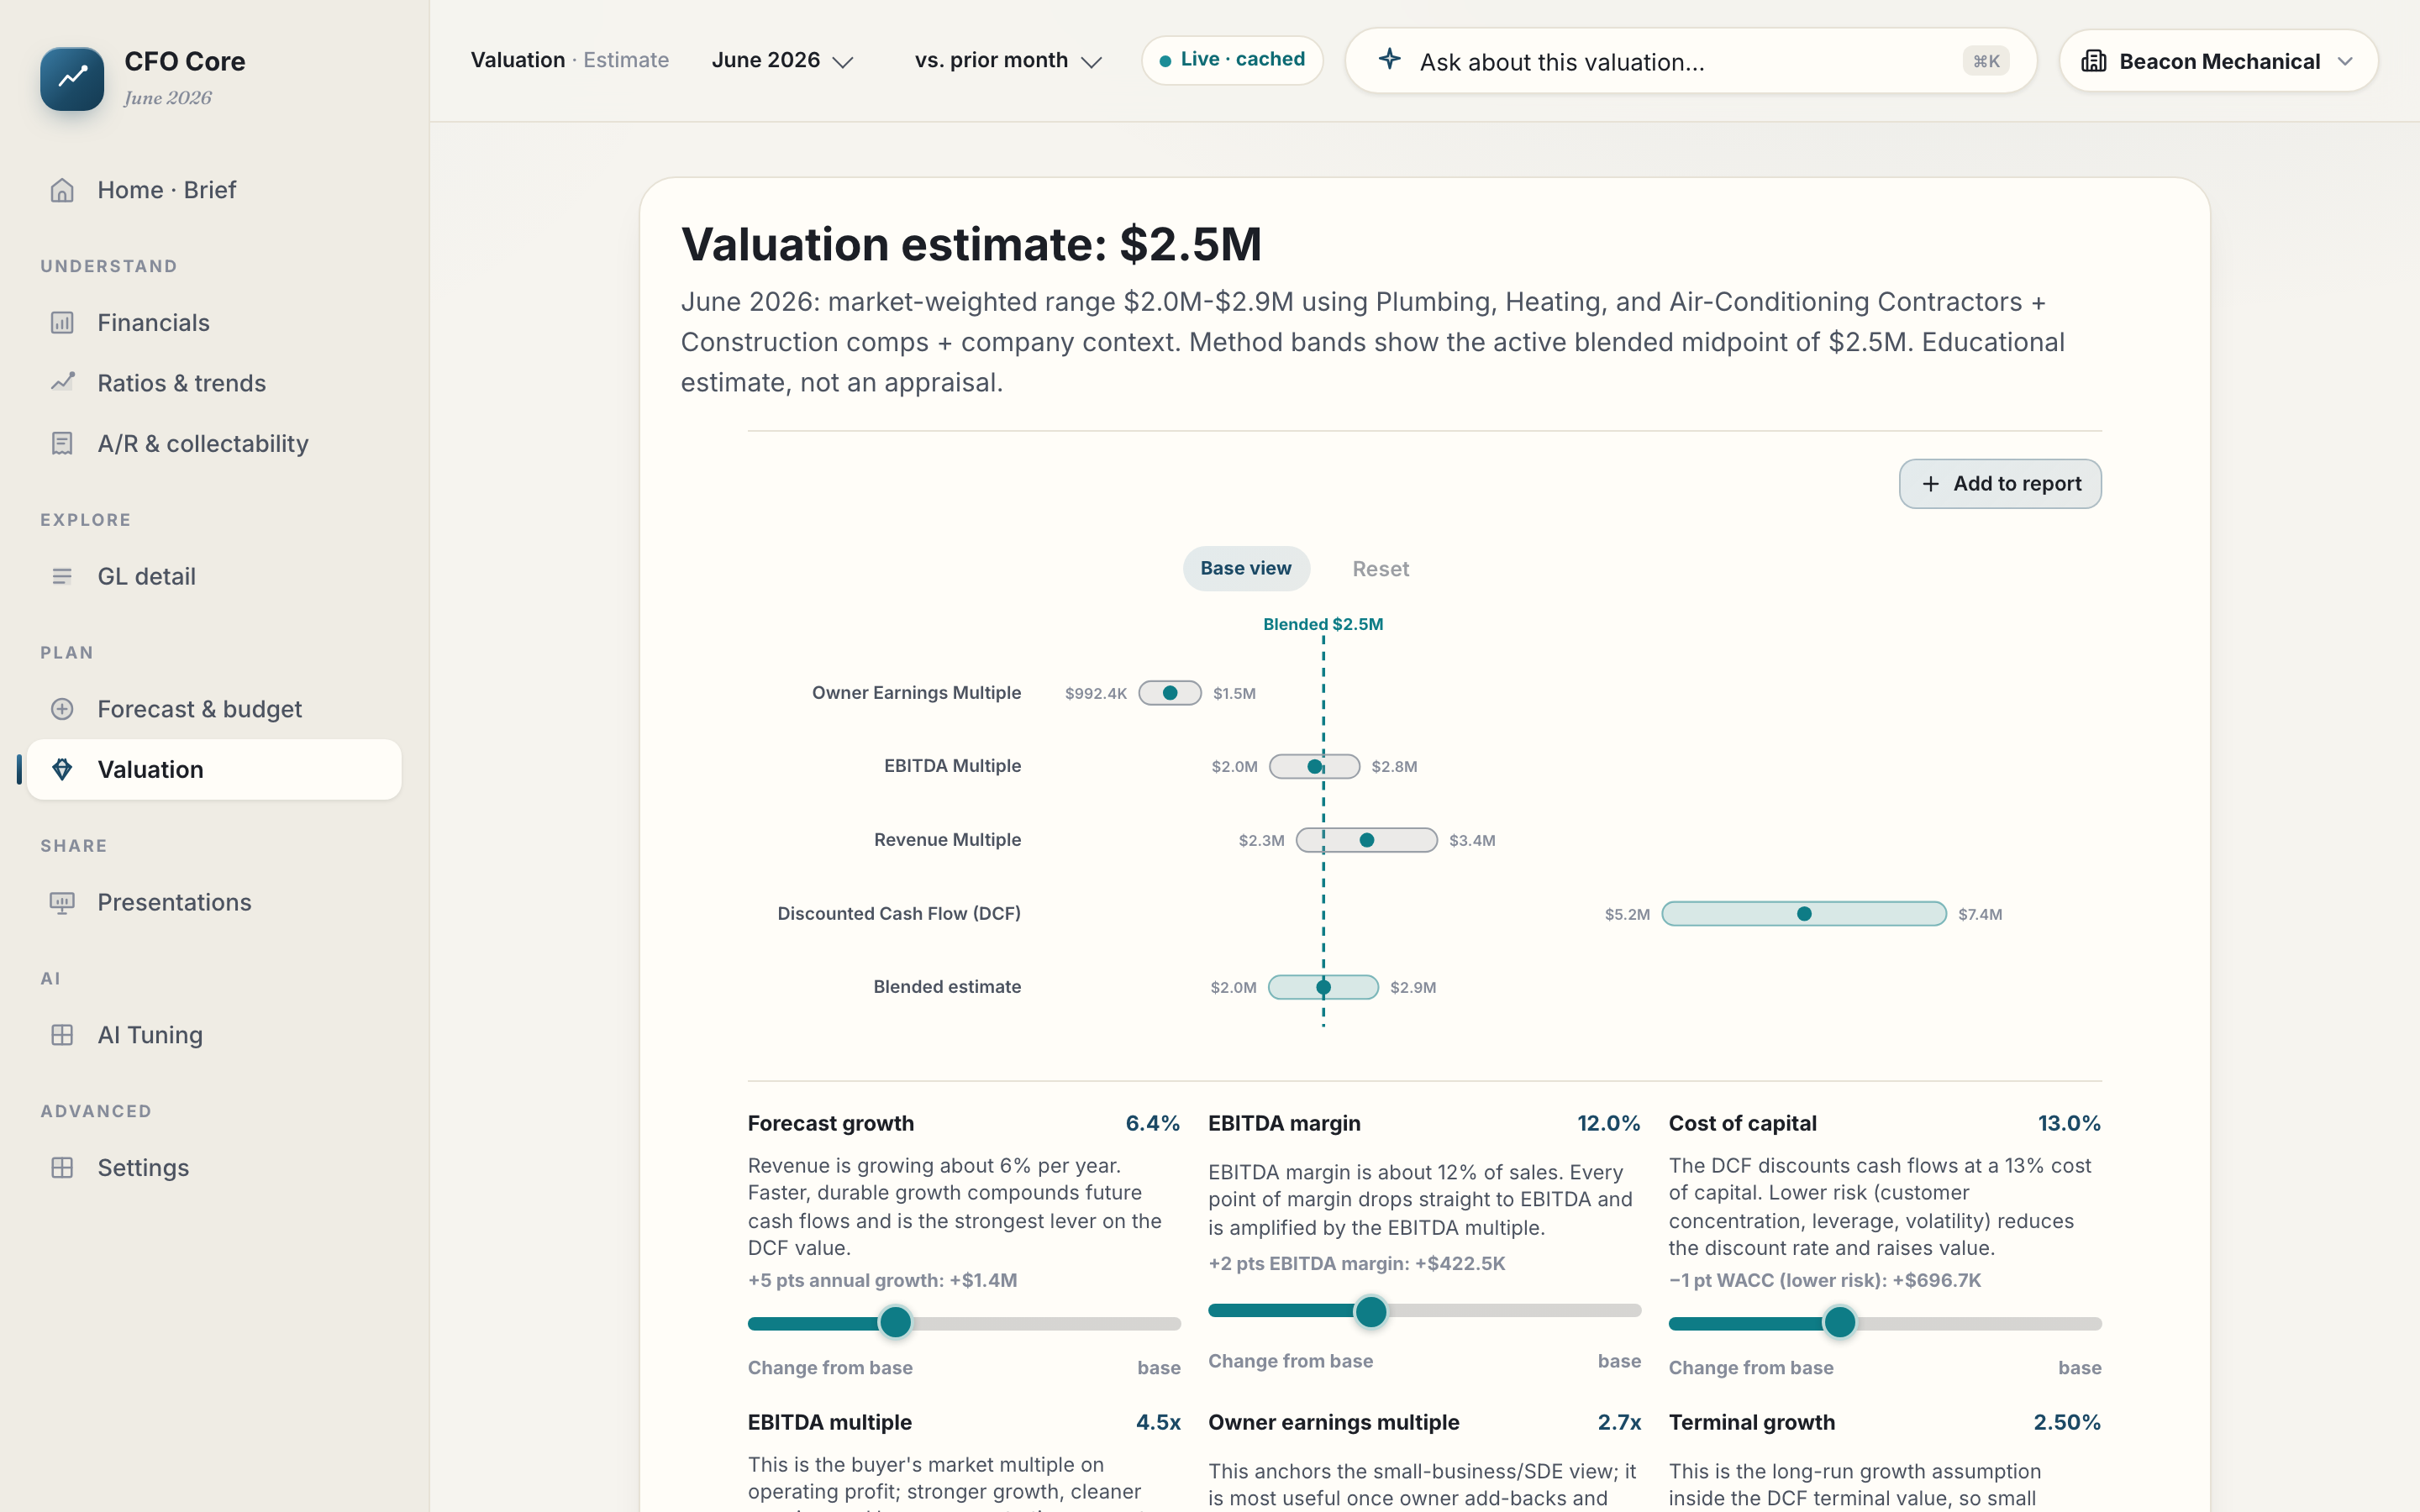
A 24-month three-statement forecast with High / Expected / Low bands, exported as a native Excel model — 11 sheets, real formulas, a case toggle on the Drivers sheet, and an Accuracy sheet that backtests the model against the client's own closed months, so the model shows its record instead of asserting one. Alongside it, a defensible valuation — blended across methods and benchmarked — so you can put a price on what a point of gross margin is worth at sale. This is the analysis that used to mean a $5,000 engagement — drafted for your review, in the same session.
The client sees a model they can hand a lender. You spent the hour on the conversation, not the spreadsheet.
Build the model, keep the margin
Live product — sample data (Rivertown Advisory, a fictional firm). Open this screen live — no signup →
Every deliverable on this page comes from a deterministic pipeline over the client's general ledger — the same math every time. AI writes the explanations on top, and every figure links to the transactions behind it. It replaces the grunt work, not your judgment or your relationship. Nothing reaches a client until you've reviewed it.
Any figure, any deliverable → the transactions behind it. Audit the AI before your client asks. Sample data — Beacon Mechanical, a fictional company
Every deliverable here, drafted from real QuickBooks and branded as yours. Start with one client and see the deliverables on real books before you commit the firm.
Start with one client — free 14 days →